Shaw 2010 Annual Report Download - page 110
Download and view the complete annual report
Please find page 110 of the 2010 Shaw annual report below. You can navigate through the pages in the report by either clicking on the pages listed below, or by using the keyword search tool below to find specific information within the annual report.-
 1
1 -
2
-
3
-
4
-
5
-
6
-
7
-
8
-
9
-
10
-
11
-
12
-
13
-
14
-
15
-
16
-
17
-
18
-
19
-
20
-
21
-
22
-
23
-
24
-
25
-
26
-
27
-
28
-
29
-
30
-
31
-
32
-
33
-
34
-
35
-
36
-
37
-
38
-
39
-
40
-
41
-
42
-
43
-
44
-
45
-
46
-
47
-
48
-
49
-
50
-
51
-
52
-
53
-
54
-
55
-
56
-
57
-
58
-
59
-
60
-
61
-
62
-
63
-
64
-
65
-
66
-
67
-
68
-
69
-
70
-
71
-
72
-
73
-
74
-
75
-
76
-
77
-
78
-
79
-
80
-
81
-
82
-
83
-
84
-
85
-
86
-
87
-
88
-
89
-
90
-
91
-
92
-
93
-
94
-
95
-
96
-
97
-
98
-
99
-
 100
100 -
 101
101 -
 102
102 -
 103
103 -
 104
104 -
 105
105 -
 106
106 -
 107
107 -
 108
108 -
 109
109 -
 110
110 -
 111
111 -
 112
112 -
 113
113 -
 114
114 -
 115
115 -
 116
116 -
 117
117 -
 118
118 -
 119
119 -
 120
120 -
121
-
122
-
123
-
124
-
125
-
126
 |
 |

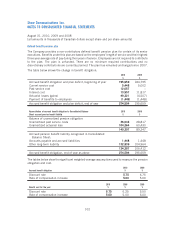
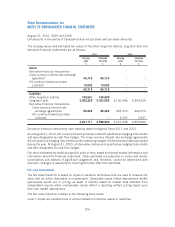
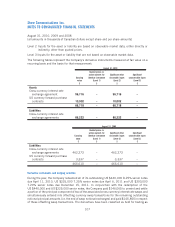
The carrying values and estimated fair values of the other long-term liability, long-term debt and
derivative financial instruments are as follows:
Carrying
value
$
Estimated
fair value
$
Carrying
value
$
Estimated
fair value
$
2010 2009
Assets
Derivative financial instruments –
Cross-currency interest rate exchange
agreement 56,716 56,716 ––
US currency forward purchase
contracts 10,002 10,002 ––
66,718 66,718 ––
Liabilities
Other long-term liability 158,661 159,689 ––
Long-term debt 3,982,228 4,353,028 3,150,488 3,394,224
Derivative financial instruments –
Cross-currency interest rate
exchange agreements 86,222 86,222 462,273 462,273
US currency forward purchase
contracts ––3,337 3,337
4,227,111 4,598,939 3,616,098 3,859,834
Derivative financial instruments have maturity dates throughout fiscal 2011 and 2012.
As at August 31, 2010, US currency forward purchase contracts qualified as hedging instruments
and were designated as cash flow hedges. The cross-currency interest rate exchange agreements
did not qualify as hedging instruments as the underlying hedged US denominated debt was repaid
during the year. At August 31, 2009, all derivative instruments qualified as hedging instruments
and were designated as cash flow hedges.
Fair value estimates are made at a specific point in time, based on relevant market information and
information about the financial instrument. These estimates are subjective in nature and involve
uncertainties and matters of significant judgement and, therefore, cannot be determined with
precision. Changes in assumptions could significantly affect the estimates.
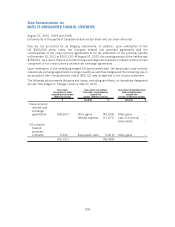
Fair value measurements
The fair value hierarchy is based on inputs to valuation techniques that are used to measure fair
value that are either observable or unobservable. Observable inputs reflect assumptions market
participants would use in pricing an asset or liability based on market data obtained from
independent sources while unobservable inputs reflect a reporting entity’s pricing based upon
their own market assumptions.
The fair value hierarchy consists of the following three levels:
Level 1 Inputs are quoted prices in active markets for identical assets or liabilities.
106
Shaw Communications Inc.
NOTES TO CONSOLIDATED FINANCIAL STATEMENTS
August 31, 2010, 2009 and 2008
[all amounts in thousands of Canadian dollars except share and per share amounts]