Sears 2015 Annual Report Download - page 82
Download and view the complete annual report
Please find page 82 of the 2015 Sears annual report below. You can navigate through the pages in the report by either clicking on the pages listed below, or by using the keyword search tool below to find specific information within the annual report.-
 1
1 -
2
-
3
-
4
-
5
-
6
-
7
-
8
-
9
-
10
-
11
-
12
-
13
-
14
-
15
-
16
-
17
-
18
-
19
-
20
-
21
-
22
-
23
-
24
-
25
-
26
-
27
-
28
-
29
-
30
-
31
-
32
-
33
-
34
-
35
-
36
-
37
-
38
-
39
-
40
-
41
-
42
-
43
-
44
-
45
-
46
-
47
-
48
-
49
-
50
-
51
-
52
-
53
-
54
-
55
-
56
-
57
-
58
-
59
-
60
-
61
-
62
-
63
-
64
-
65
-
66
-
67
-
68
-
69
-
70
-
71
-
 72
72 -
 73
73 -
 74
74 -
 75
75 -
 76
76 -
 77
77 -
 78
78 -
 79
79 -
 80
80 -
 81
81 -
 82
82 -
 83
83 -
 84
84 -
 85
85 -
 86
86 -
 87
87 -
 88
88 -
 89
89 -
 90
90 -
 91
91 -
 92
92 -
93
-
94
-
95
-
96
-
97
-
98
-
99
-
100
-
101
-
102
-
103
-
104
-
105
-
106
-
107
-
108
-
109
-
110
-
111
-
112
-
113
-
114
-
115
-
116
-
117
-
118
-
119
-
120
-
121
-
122
-
123
-
124
-
125
-
126
-
127
-
128
-
129
-
130
-
131
-
132
 |
 |

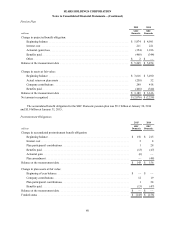
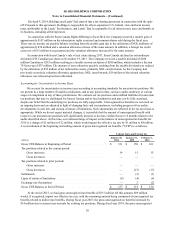
Weighted-average assumptions used to determine net cost were as follows:
2015 2014 2013
SHC
Domestic
SHC
Domestic
Sears
Canada
SHC
Domestic
Sears
Canada
Pension benefits:
Discount Rate . . . . . . . . . . . . . . . . . . . . . . . . . . . . . 3.70% 4.60% 4.20% 4.25% 4.20%
Return of plan assets . . . . . . . . . . . . . . . . . . . . . . . 7.00% 7.00% 6.50% 7.00% 6.50%
Rate of compensation increases . . . . . . . . . . . . . . . N/A N/A 3.50% N/A 3.50%
Postretirement benefits:
Discount Rate . . . . . . . . . . . . . . . . . . . . . . . . . . . . . 3.30% 4.00% 3.90% 3.55% 4.20%
Return of plan assets . . . . . . . . . . . . . . . . . . . . . . . N/A N/A 1.00% N/A 3.75%
Rate of compensation increases . . . . . . . . . . . . . . . N/A N/A 3.50% N/A 3.50%
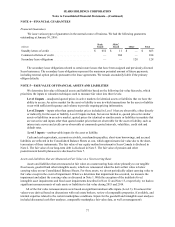
For purposes of determining the periodic expense of our defined benefit plans, we use the fair value of plan
assets as the market related value. A one-percentage-point change in the assumed discount rate would have the
following effects on the pension liability:
millions
1€percentage-point
Increase
1€percentage-point
Decrease
Effect on interest cost component . . . . . . . . . . . . . . . . . . . . . . . . . . . . . . . . $23 $(30)
Effect on pension benefit obligation . . . . . . . . . . . . . . . . . . . . . . . . . . . . . . $(498) $ 596
Approximately $255 million of the unrecognized net losses in accumulated other comprehensive income are
expected to be amortized as a component of net periodic benefit cost during 2016.
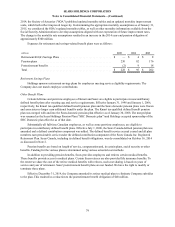
Investment Strategy
The Investment Committee, made up of select members of senior management, has appointed a non-affiliated
third party professional to advise the Committee with respect to the SHC domestic pension plan assets. The plan's
overall investment objective is to provide a long-term return that, along with Company contributions, is expected to
meet future benefit payment requirements. A long-term horizon has been adopted in establishing investment policy
such that the likelihood and duration of investment losses are carefully weighed against the long-term potential for
appreciation of assets. The plan's investment policy requires investments to be diversified across individual
securities, industries, market capitalization and valuation characteristics. In addition, various techniques are utilized
to monitor, measure and manage risk.
Domestic plan assets were invested in the following classes of securities:
€
Plan Assets at
January 30,
2016
January 31,
2015
Equity securities . . . . . . . . . . . . . . . . . . . . . . . . . . . . . . . . . . . . . . . . . . . . . . . . . . . . . . . 34%33%
Fixed income and other debt securities . . . . . . . . . . . . . . . . . . . . . . . . . . . . . . . . . . . . . 63 63
Other . . . . . . . . . . . . . . . . . . . . . . . . . . . . . . . . . . . . . . . . . . . . . . . . . . . . . . . . . . . . . . . . 3 4
Total . . . . . . . . . . . . . . . . . . . . . . . . . . . . . . . . . . . . . . . . . . . . . . . . . . . . . . . . . . . . . . . . 100%100%
The domestic plan's target allocation is determined by taking into consideration the amounts and timing of
projected liabilities, our funding policies and expected returns on various asset classes. At January€30, 2016, the
plan's target asset allocation was 35% equity and 65% fixed income. To develop the expected long-term rate of
return on assets assumption, we considered the historical returns and the future expectations for returns for each
asset class, as well as the target asset allocation of the pension portfolio.
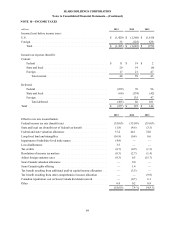
SEARS HOLDINGS CORPORATION
Notes to Consolidated Financial Statements—(Continued)
82