Sears 2015 Annual Report Download - page 36
Download and view the complete annual report
Please find page 36 of the 2015 Sears annual report below. You can navigate through the pages in the report by either clicking on the pages listed below, or by using the keyword search tool below to find specific information within the annual report.-
 1
1 -
2
-
3
-
4
-
5
-
6
-
7
-
8
-
9
-
10
-
11
-
12
-
13
-
14
-
15
-
16
-
17
-
18
-
19
-
20
-
21
-
22
-
23
-
24
-
25
-
 26
26 -
 27
27 -
 28
28 -
 29
29 -
 30
30 -
 31
31 -
 32
32 -
 33
33 -
 34
34 -
 35
35 -
 36
36 -
 37
37 -
 38
38 -
 39
39 -
 40
40 -
 41
41 -
 42
42 -
 43
43 -
 44
44 -
 45
45 -
 46
46 -
47
-
48
-
49
-
50
-
51
-
52
-
53
-
54
-
55
-
56
-
57
-
58
-
59
-
60
-
61
-
62
-
63
-
64
-
65
-
66
-
67
-
68
-
69
-
70
-
71
-
72
-
73
-
74
-
75
-
76
-
77
-
78
-
79
-
80
-
81
-
82
-
83
-
84
-
85
-
86
-
87
-
88
-
89
-
90
-
91
-
92
-
93
-
94
-
95
-
96
-
97
-
98
-
99
-
100
-
101
-
102
-
103
-
104
-
105
-
106
-
107
-
108
-
109
-
110
-
111
-
112
-
113
-
114
-
115
-
116
-
117
-
118
-
119
-
120
-
121
-
122
-
123
-
124
-
125
-
126
-
127
-
128
-
129
-
130
-
131
-
132
 |
 |

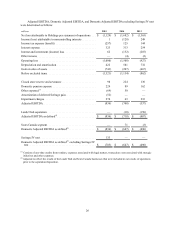
Income Taxes
We recorded income tax expense of $125 million and $144 million in 2014 and 2013, respectively. Our
effective tax rate for 2014 was 7.4% compared to 14.8% in 2013. The application of the requirements for accounting
for income taxes, after consideration of our valuation allowance, causes a significant variation in the typical
relationship between income tax expense and pretax income/loss.€Our tax rate in 2014 continues to reflect the effect
of not recognizing the benefit of current period losses in certain domestic and foreign jurisdictions where it is not
more likely than not that such benefits would be realized.€The 2014 rate was negatively impacted by a valuation
allowance established on Sears Canada’s deferred tax assets in the third quarter, prior to de-consolidation, and
increased foreign taxes in Puerto Rico resulting from a new tax law change, which became effective during the
second quarter of 2014. These items were partially offset by state audit settlements and statute expirations. In
addition, the 2014 rate was favorably impacted by the book to tax difference for the original issue discount relating
to the $625 million 8% senior unsecured notes issued in November 2014, which resulted in the creation of a deferred
tax liability through additional paid-in capital and a valuation allowance reversal through continuing operations.
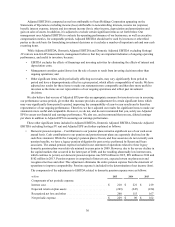
Business Segment Results
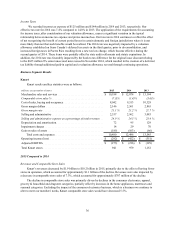
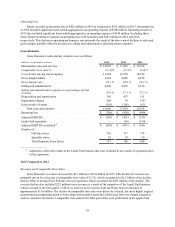
Kmart
Kmart results and key statistics were as follows:
millions, except number of stores 2015 2014 2013
Merchandise sales and services . . . . . . . . . . . . . . . . . . . . . . . . . . . . . . . . $ 10,188 $ 12,074 $ 13,194
Comparable store sales % . . . . . . . . . . . . . . . . . . . . . . . . . . . . . . . . . . . . (7.3)% (1.4)% (3.6)%
Cost of sales, buying and occupancy . . . . . . . . . . . . . . . . . . . . . . . . . . . . 8,042 9,513 10,329
Gross margin dollars . . . . . . . . . . . . . . . . . . . . . . . . . . . . . . . . . . . . . . . . 2,146 2,561 2,865
Gross margin rate . . . . . . . . . . . . . . . . . . . . . . . . . . . . . . . . . . . . . . . . . . 21.1 % 21.2 % 21.7 %
Selling and administrative . . . . . . . . . . . . . . . . . . . . . . . . . . . . . . . . . . . . 2,537 2,962 3,083
Selling and administrative expense as a percentage of total revenues . . 24.9 %24.5 %23.4 %
Depreciation and amortization. . . . . . . . . . . . . . . . . . . . . . . . . . . . . . . . . 72 95 129
Impairment charges . . . . . . . . . . . . . . . . . . . . . . . . . . . . . . . . . . . . . . . . . 14 29 70
Gain on sales of assets . . . . . . . . . . . . . . . . . . . . . . . . . . . . . . . . . . . . . . . (185) (103) (66)
Total costs and expenses. . . . . . . . . . . . . . . . . . . . . . . . . . . . . . . . . . 10,480 12,496 13,545
Operating income (loss). . . . . . . . . . . . . . . . . . . . . . . . . . . . . . . . . . . . . . $ (292) $ (422) $ (351)
Adjusted EBITDA . . . . . . . . . . . . . . . . . . . . . . . . . . . . . . . . . . . . . . . . . . $(273) $ (216) $ (129)
Total Kmart stores . . . . . . . . . . . . . . . . . . . . . . . . . . . . . . . . . . . . . . . . . . 941 979 1,152
2015 Compared to 2014
Revenues and Comparable Store Sales
Kmart’s revenues decreased by $1.9 billion to $10.2 billion in 2015, primarily due to the effect of having fewer
stores in operation, which accounted for approximately $1.1 billion of the decline. Revenues were also impacted by
a decrease in comparable store sales of 7.3%, which accounted for approximately $787 million of the decline.
The decline in comparable store sales was primarily driven by declines in the consumer electronics, apparel,
grocery & household and drugstore categories, partially offset by increases in the home appliances, mattresses and
seasonal categories. Excluding the impact of the consumer electronics business, which is a business we continue to
alter to meet our members' needs, Kmart comparable store sales would have decreased 5.5%.
36