Sears 2015 Annual Report Download - page 56
Download and view the complete annual report
Please find page 56 of the 2015 Sears annual report below. You can navigate through the pages in the report by either clicking on the pages listed below, or by using the keyword search tool below to find specific information within the annual report.-
 1
1 -
2
-
3
-
4
-
5
-
6
-
7
-
8
-
9
-
10
-
11
-
12
-
13
-
14
-
15
-
16
-
17
-
18
-
19
-
20
-
21
-
22
-
23
-
24
-
25
-
26
-
27
-
28
-
29
-
30
-
31
-
32
-
33
-
34
-
35
-
36
-
37
-
38
-
39
-
40
-
41
-
42
-
43
-
44
-
45
-
 46
46 -
 47
47 -
 48
48 -
 49
49 -
 50
50 -
 51
51 -
 52
52 -
 53
53 -
 54
54 -
 55
55 -
 56
56 -
 57
57 -
 58
58 -
 59
59 -
 60
60 -
 61
61 -
 62
62 -
 63
63 -
 64
64 -
 65
65 -
 66
66 -
67
-
68
-
69
-
70
-
71
-
72
-
73
-
74
-
75
-
76
-
77
-
78
-
79
-
80
-
81
-
82
-
83
-
84
-
85
-
86
-
87
-
88
-
89
-
90
-
91
-
92
-
93
-
94
-
95
-
96
-
97
-
98
-
99
-
100
-
101
-
102
-
103
-
104
-
105
-
106
-
107
-
108
-
109
-
110
-
111
-
112
-
113
-
114
-
115
-
116
-
117
-
118
-
119
-
120
-
121
-
122
-
123
-
124
-
125
-
126
-
127
-
128
-
129
-
130
-
131
-
132
 |
 |
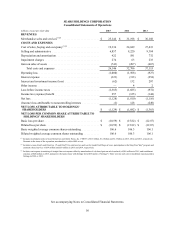
SEARS HOLDINGS CORPORATION
Consolidated Statements of Operations
millions, except per share data 2015 2014 2013
REVENUES
Merchandise sales and services(1)(2) . . . . . . . . . . . . . . . . . . . . . . . . . . $25,146 $31,198 $36,188
COSTS AND EXPENSES
Cost of sales, buying and occupancy(1)(3) . . . . . . . . . . . . . . . . . . . . . . 19,336 24,049 27,433
Selling and administrative . . . . . . . . . . . . . . . . . . . . . . . . . . . . . . . . . 6,857 8,220 9,384
Depreciation and amortization . . . . . . . . . . . . . . . . . . . . . . . . . . . . . . 422 581 732
Impairment charges . . . . . . . . . . . . . . . . . . . . . . . . . . . . . . . . . . . . . . 274 63 233
Gain on sales of assets . . . . . . . . . . . . . . . . . . . . . . . . . . . . . . . . . . . . (743)(207)(667)
Total costs and expenses . . . . . . . . . . . . . . . . . . . . . . . . . . . . . . . 26,146 32,706 37,115
Operating loss . . . . . . . . . . . . . . . . . . . . . . . . . . . . . . . . . . . . . . . . . . . (1,000)(1,508)(927)
Interest expense . . . . . . . . . . . . . . . . . . . . . . . . . . . . . . . . . . . . . . . . . (323)(313)(254)
Interest and investment income (loss) . . . . . . . . . . . . . . . . . . . . . . . . (62)132 207
Other income . . . . . . . . . . . . . . . . . . . . . . . . . . . . . . . . . . . . . . . . . . . — 4 2
Loss before income taxes . . . . . . . . . . . . . . . . . . . . . . . . . . . . . . . . . . (1,385)(1,685)(972)
Income tax (expense) benefit . . . . . . . . . . . . . . . . . . . . . . . . . . . . . . . 257 (125)(144)
Net loss . . . . . . . . . . . . . . . . . . . . . . . . . . . . . . . . . . . . . . . . . . . . . . . . (1,128)(1,810)(1,116)
(Income) loss attributable to noncontrolling interests . . . . . . . . . . . . (1)128 (249)
NET LOSS ATTRIBUTABLE TO HOLDINGS’
SHAREHOLDERS . . . . . . . . . . . . . . . . . . . . . . . . . . . . . . . . . . . . . $(1,129) $ (1,682) $ (1,365)
NET LOSS PER COMMON SHARE ATTRIBUTABLE TO
HOLDINGS’ SHAREHOLDERS
Basic loss per share. . . . . . . . . . . . . . . . . . . . . . . . . . . . . . . . . . . . . . . $(10.59) $ (15.82) $ (12.87)
Diluted loss per share . . . . . . . . . . . . . . . . . . . . . . . . . . . . . . . . . . . . . $(10.59) $ (15.82) $ (12.87)
Basic weighted average common shares outstanding. . . . . . . . . . . . . 106.6 106.3 106.1
Diluted weighted average common shares outstanding . . . . . . . . . . . 106.6 106.3 106.1
(1) Includes merchandise sales to Sears Hometown and Outlet Stores, Inc. ("SHO") of $1.3 billion, $1.4 billion and $1.5 billion in 2015, 2014 and 2013, respectively.
Pursuant to the terms of the separation, merchandise is sold to SHO at cost.
(2) Includes revenue from Lands' End, Inc. ("Lands' End") for retail services and rent for Lands' End Shops at Sears, participation in the Shop Your Way® program and
corporate shared services of $59 million and $59 million in 2015 and 2014, respectively.
(3) Includes rent expense (consisting of straight-line rent expense offset by amortization of a deferred gain on sale-leaseback) of $49 million in 2015, and installment
expenses of $40 million in 2015, pursuant to the master lease with Seritage Growth Properties ("Seritage"). There were no such rent or installment expenses paid to
Seritage in 2014 or 2013.
See accompanying Notes to Consolidated Financial Statements.
56