Sears 2015 Annual Report Download - page 41
Download and view the complete annual report
Please find page 41 of the 2015 Sears annual report below. You can navigate through the pages in the report by either clicking on the pages listed below, or by using the keyword search tool below to find specific information within the annual report.-
 1
1 -
2
-
3
-
4
-
5
-
6
-
7
-
8
-
9
-
10
-
11
-
12
-
13
-
14
-
15
-
16
-
17
-
18
-
19
-
20
-
21
-
22
-
23
-
24
-
25
-
26
-
27
-
28
-
29
-
30
-
 31
31 -
 32
32 -
 33
33 -
 34
34 -
 35
35 -
 36
36 -
 37
37 -
 38
38 -
 39
39 -
 40
40 -
 41
41 -
 42
42 -
 43
43 -
 44
44 -
 45
45 -
 46
46 -
 47
47 -
 48
48 -
 49
49 -
 50
50 -
 51
51 -
52
-
53
-
54
-
55
-
56
-
57
-
58
-
59
-
60
-
61
-
62
-
63
-
64
-
65
-
66
-
67
-
68
-
69
-
70
-
71
-
72
-
73
-
74
-
75
-
76
-
77
-
78
-
79
-
80
-
81
-
82
-
83
-
84
-
85
-
86
-
87
-
88
-
89
-
90
-
91
-
92
-
93
-
94
-
95
-
96
-
97
-
98
-
99
-
100
-
101
-
102
-
103
-
104
-
105
-
106
-
107
-
108
-
109
-
110
-
111
-
112
-
113
-
114
-
115
-
116
-
117
-
118
-
119
-
120
-
121
-
122
-
123
-
124
-
125
-
126
-
127
-
128
-
129
-
130
-
131
-
132
 |
 |

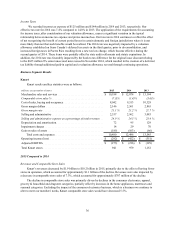
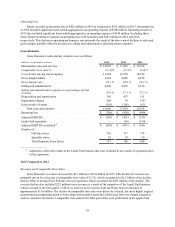
2015 and 2014, respectively. The increase in operating loss in 2015 was driven by the above noted decrease in gross
margin, partially offset by the decline in selling and administrative expenses.
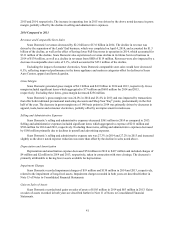
2014 Compared to 2013
Revenues and Comparable Store Sales
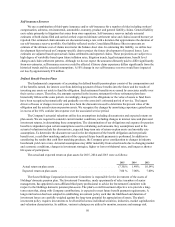
Sears Domestic's revenues decreased by $2.2 billion to $17.0 billion in 2014. The decline in revenue was
driven by the separation of the Lands' End business, which was completed on April 4, 2014, and accounted for $1.3
billion of the decline, as well as the effect of having fewer Full-line stores in operation in 2014, which accounted for
$311 million of the decline. Sears Domestic also experienced a revenue decline in its Home Services business in
2014 of $139 million, as well as a decline in revenues from SHO of $119 million. Revenues were also impacted by a
decrease in comparable store sales of 2.1%, which accounted for $251 million of the decline.
Excluding the impact of consumer electronics, Sears Domestic comparable store sales would have decreased
0.5%, reflecting improved performance in the home appliance and mattress categories offset by declines in Sears
Auto Centers, apparel and lawn & garden.
Gross Margin
Sears Domestic generated gross margin of $4.1 billion and $4.9 billion in 2014 and 2013, respectively. Gross
margin included significant items which aggregated to $73 million and $605 million for 2014 and 2013,
respectively. Excluding these items, gross margin decreased $256 million.
Sears Domestic’s gross margin rate was 24.0% in 2014 and 25.4% in 2013 and was impacted by transactions
that offer both traditional promotional marketing discounts and Shop Your Way® points, predominantly in the first
half of the year. The decrease in gross margin rate of 140 basis points in 2014 was primarily driven by decreases in
apparel, tools, home and consumer electronics, partially offset by an improvement in mattresses.
Selling and Administrative Expenses
Sears Domestic’s selling and administrative expenses decreased $561 million in 2014 as compared to 2013.
Selling and administrative expenses included significant items which aggregated to expense of $211 million and
$586 million for 2014 and 2013, respectively. Excluding these items, selling and administrative expenses decreased
by $186 million primarily due to declines in payroll and advertising expenses.
Sears Domestic’s selling and administrative expense rate was 27.3% in 2014 and 27.2% in 2013 and increased
slightly as the above noted expense reduction was more than offset by the decline in sales noted above.
Depreciation and Amortization
Depreciation and amortization expense decreased $74 million in 2014 to $437 million and included charges of
$4 million and $2 million in 2014 and 2013, respectively, taken in connection with store closings. The decrease is
primarily attributable to having fewer assets available for depreciation.
Impairment Charges
Sears Domestic recorded impairment charges of $19 million and $150 million in 2014 and 2013, respectively,
related to the impairment of long-lived assets. Impairment charges recorded in both years are described further in
Note 13 of Notes to Consolidated Financial Statements.
Gain on Sales of Assets
Sears Domestic recorded total gains on sales of assets of $105 million in 2014 and $63 million in 2013. Gains
on sales of assets recorded in both years are described further in Note 11 of Notes to Consolidated Financial
Statements.
41