Sears 2015 Annual Report Download - page 39
Download and view the complete annual report
Please find page 39 of the 2015 Sears annual report below. You can navigate through the pages in the report by either clicking on the pages listed below, or by using the keyword search tool below to find specific information within the annual report.-
 1
1 -
2
-
3
-
4
-
5
-
6
-
7
-
8
-
9
-
10
-
11
-
12
-
13
-
14
-
15
-
16
-
17
-
18
-
19
-
20
-
21
-
22
-
23
-
24
-
25
-
26
-
27
-
28
-
 29
29 -
 30
30 -
 31
31 -
 32
32 -
 33
33 -
 34
34 -
 35
35 -
 36
36 -
 37
37 -
 38
38 -
 39
39 -
 40
40 -
 41
41 -
 42
42 -
 43
43 -
 44
44 -
 45
45 -
 46
46 -
 47
47 -
 48
48 -
 49
49 -
50
-
51
-
52
-
53
-
54
-
55
-
56
-
57
-
58
-
59
-
60
-
61
-
62
-
63
-
64
-
65
-
66
-
67
-
68
-
69
-
70
-
71
-
72
-
73
-
74
-
75
-
76
-
77
-
78
-
79
-
80
-
81
-
82
-
83
-
84
-
85
-
86
-
87
-
88
-
89
-
90
-
91
-
92
-
93
-
94
-
95
-
96
-
97
-
98
-
99
-
100
-
101
-
102
-
103
-
104
-
105
-
106
-
107
-
108
-
109
-
110
-
111
-
112
-
113
-
114
-
115
-
116
-
117
-
118
-
119
-
120
-
121
-
122
-
123
-
124
-
125
-
126
-
127
-
128
-
129
-
130
-
131
-
132
 |
 |

Operating Loss
Kmart recorded an operating loss of $422 million in 2014 as compared to $351 million in 2013. Operating loss
in 2014 included significant items which aggregated to an operating expense of $208 million. Operating income in
2013 also included significant items which aggregated to an operating expense of $144 million. Excluding these
items, Kmart would have reported an operating loss of $214 million and $207 million in 2014 and 2013,
respectively. This decline in operating performance was primarily the result of the above noted declines in sales and
gross margin, partially offset by decreases in selling and administrative and depreciation expenses.
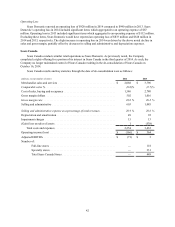
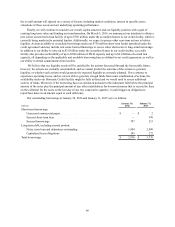
Sears Domestic
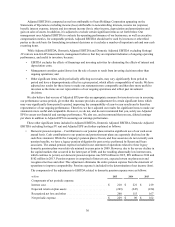
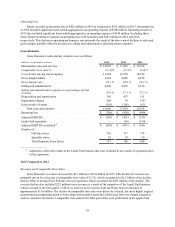
Sears Domestic results and key statistics were as follows:
millions, except number of stores 2015 2014 2013
Merchandise sales and services . . . . . . . . . . . . . . . . . . . . . . . . . . . . . $ 14,958 $ 17,036 $ 19,198
Comparable store sales %. . . . . . . . . . . . . . . . . . . . . . . . . . . . . . . . . (11.1)% (2.1)% (1.4)%
Cost of sales, buying and occupancy. . . . . . . . . . . . . . . . . . . . . . . . . 11,294 12,950 14,324
Gross margin dollars . . . . . . . . . . . . . . . . . . . . . . . . . . . . . . . . . . . . . 3,664 4,086 4,874
Gross margin rate . . . . . . . . . . . . . . . . . . . . . . . . . . . . . . . . . . . . . . . 24.5 % 24.0 % 25.4 %
Selling and administrative . . . . . . . . . . . . . . . . . . . . . . . . . . . . . . . . . 4,320 4,655 5,216
Selling and administrative expense as a percentage of total
revenues . . . . . . . . . . . . . . . . . . . . . . . . . . . . . . . . . . . . . . . . . . . . . . . 28.9 %27.3 %27.2 %
Depreciation and amortization . . . . . . . . . . . . . . . . . . . . . . . . . . . . . 350 437 511
Impairment charges . . . . . . . . . . . . . . . . . . . . . . . . . . . . . . . . . . . . . . 260 19 150
Gain on sales of assets. . . . . . . . . . . . . . . . . . . . . . . . . . . . . . . . . . . . (558) (105) (63)
Total costs and expenses. . . . . . . . . . . . . . . . . . . . . . . . . . . . . . . 15,666 17,956 20,138
Operating loss . . . . . . . . . . . . . . . . . . . . . . . . . . . . . . . . . . . . . . . . . . $ (708) $ (920) $ (940)
Adjusted EBITDA . . . . . . . . . . . . . . . . . . . . . . . . . . . . . . . . . . . . . . . $(563) $ (421) $ (211)
Lands' End separation . . . . . . . . . . . . . . . . . . . . . . . . . . . . . . . . . . . . — (10) (150)
Adjusted EBITDA as defined(1) . . . . . . . . . . . . . . . . . . . . . . . . . . . . . $ (563) $ (431) $ (361)
Number of:
Full-line stores. . . . . . . . . . . . . . . . . . . . . . . . . . . . . . . . . . . 705 717 778
Specialty stores . . . . . . . . . . . . . . . . . . . . . . . . . . . . . . . . . . 26 29 50
Total Domestic Sears Stores . . . . . . . . . . . . . . . . . . . . . . . . 731 746 828
__________________
(1) Adjusted to reflect the results of the Lands' End business that were included in our results of operations prior
to the separation.
2015 Compared to 2014
Revenues and Comparable Store Sales
Sears Domestic's revenues decreased by $2.1 billion to $15.0 billion in 2015. This decline in revenues was
primarily driven by a decrease in comparable store sales of 11.1%, which accounted for $1.2 billion of the decline,
and the effect of having fewer Full-line stores in operation, which accounted for $433 million of the decline. The
revenue decline also included $222 million lower revenue as a result of the separation of the Lands' End business,
which occurred in the first quarter of 2014, as well as lower revenues from our Home Services business of
approximately $110 million. The decline in comparable store sales was driven by reduced, but more highly targeted
promotional and marketing spend to better align with member needs and a shift away from low margin categories,
such as consumer electronics. Comparable store sales in the latter part of the year, particularly in the apparel and
39