Sears 2015 Annual Report Download - page 28
Download and view the complete annual report
Please find page 28 of the 2015 Sears annual report below. You can navigate through the pages in the report by either clicking on the pages listed below, or by using the keyword search tool below to find specific information within the annual report.-
 1
1 -
2
-
3
-
4
-
5
-
6
-
7
-
8
-
9
-
10
-
11
-
12
-
13
-
14
-
15
-
16
-
17
-
 18
18 -
 19
19 -
 20
20 -
 21
21 -
 22
22 -
 23
23 -
 24
24 -
 25
25 -
 26
26 -
 27
27 -
 28
28 -
 29
29 -
 30
30 -
 31
31 -
 32
32 -
 33
33 -
 34
34 -
 35
35 -
 36
36 -
 37
37 -
 38
38 -
39
-
40
-
41
-
42
-
43
-
44
-
45
-
46
-
47
-
48
-
49
-
50
-
51
-
52
-
53
-
54
-
55
-
56
-
57
-
58
-
59
-
60
-
61
-
62
-
63
-
64
-
65
-
66
-
67
-
68
-
69
-
70
-
71
-
72
-
73
-
74
-
75
-
76
-
77
-
78
-
79
-
80
-
81
-
82
-
83
-
84
-
85
-
86
-
87
-
88
-
89
-
90
-
91
-
92
-
93
-
94
-
95
-
96
-
97
-
98
-
99
-
100
-
101
-
102
-
103
-
104
-
105
-
106
-
107
-
108
-
109
-
110
-
111
-
112
-
113
-
114
-
115
-
116
-
117
-
118
-
119
-
120
-
121
-
122
-
123
-
124
-
125
-
126
-
127
-
128
-
129
-
130
-
131
-
132
 |
 |

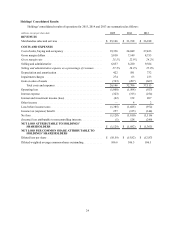
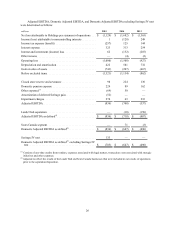
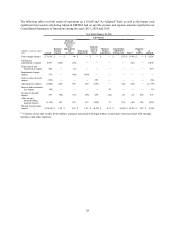
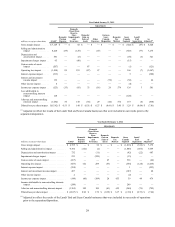
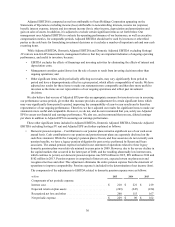
The following tables set forth results of operations on a GAAP and "As Adjusted" basis, as well as the impact each
significant item used in calculating Adjusted EBITDA had on specific income and expense amounts reported in our
Consolidated Statements of Operations during the years 2015, 2014 and 2013.
Year Ended January 30, 2016
Adjustments
millions, except per share
data GAAP
Domestic
Pension
Expense
Domestic
Closed€Store
Reserve,
Store
Impairments
and
Severance
Trade name
Impairment
Domestic
Gain on
Sales of
Assets
Mark-to-
Market
Adjustments
Amortization
of Deferred
Seritage Gain Other(1)
Domestic
Tax
Matters
As
Adjusted
Gross margin impact . . $5,810 $—$44 $—$—$—$(52) $ (146) $ —$5,656
Selling and
administrative impact .6,857 (229)(54)— — — — (82)— 6,492
Depreciation and
amortization impact 422 — (3)— — — — — — 419
Impairment charges
impact . . . . . . . . . . . . . 274 — (94)(180)— — — — — —
Gain on sales of assets
impact . . . . . . . . . . . . . (743)— — — 687 — — — — (56)
Operating loss impact .(1,000)229 195 180 (687)— (52)(64)— (1,199)
Interest and investment
loss impact . . . . . . . (62)— — — — 59 — — — (3)
Income tax benefit
impact . . . . . . . . . . . . . 257 (86)(73)(68)258 (22)20 24 263 573
After tax and
noncontrolling
interests impact . . . .
(1,129)143 122 112 (429)37 (32)(40)263 (953)
Diluted loss per share
impact . . . . . . . . . . . . . $(10.59) $ 1.34 $1.14 $1.05 $(4.02) $ 0.35 $(0.30) $ (0.38) $ 2.47 $(8.94)
(1) Consists of one-time credits from vendors, expenses associated with legal matters, transaction costs associated with strategic
initiatives and other expenses.
28