Sears 2015 Annual Report Download - page 104
Download and view the complete annual report
Please find page 104 of the 2015 Sears annual report below. You can navigate through the pages in the report by either clicking on the pages listed below, or by using the keyword search tool below to find specific information within the annual report.-
 1
1 -
2
-
3
-
4
-
5
-
6
-
7
-
8
-
9
-
10
-
11
-
12
-
13
-
14
-
15
-
16
-
17
-
18
-
19
-
20
-
21
-
22
-
23
-
24
-
25
-
26
-
27
-
28
-
29
-
30
-
31
-
32
-
33
-
34
-
35
-
36
-
37
-
38
-
39
-
40
-
41
-
42
-
43
-
44
-
45
-
46
-
47
-
48
-
49
-
50
-
51
-
52
-
53
-
54
-
55
-
56
-
57
-
58
-
59
-
60
-
61
-
62
-
63
-
64
-
65
-
66
-
67
-
68
-
69
-
70
-
71
-
72
-
73
-
74
-
75
-
76
-
77
-
78
-
79
-
80
-
81
-
82
-
83
-
84
-
85
-
86
-
87
-
88
-
89
-
90
-
91
-
92
-
93
-
 94
94 -
 95
95 -
 96
96 -
 97
97 -
 98
98 -
 99
99 -
 100
100 -
 101
101 -
 102
102 -
 103
103 -
 104
104 -
 105
105 -
 106
106 -
 107
107 -
 108
108 -
 109
109 -
 110
110 -
 111
111 -
 112
112 -
 113
113 -
 114
114 -
115
-
116
-
117
-
118
-
119
-
120
-
121
-
122
-
123
-
124
-
125
-
126
-
127
-
128
-
129
-
130
-
131
-
132
 |
 |

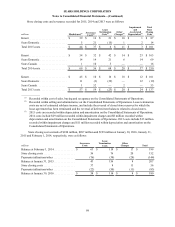
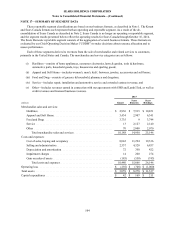
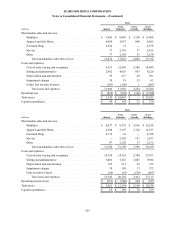
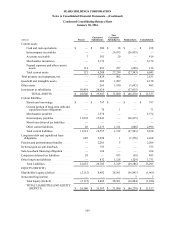
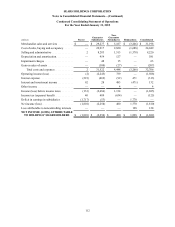
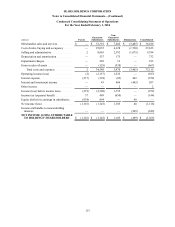
NOTE 17—SUMMARY OF SEGMENT DATA
These reportable segment classifications are based on our business formats, as described in Note 1. The Kmart
and Sears Canada formats each represent both an operating and reportable segment. As a result of the de-
consolidation of Sears Canada as described in Note 2, Sears Canada is no longer an operating or reportable segment,
and the segment results presented below reflect the operating results for Sears Canada through October 16, 2014.
The Sears Domestic reportable segment consists of the aggregation of several business formats. These formats are
evaluated by our Chief Operating Decision Maker ("CODM") to make decisions about resource allocation and to
assess performance.
Each of these segments derives its revenues from the sale of merchandise and related services to customers,
primarily in the United States and Canada. The merchandise and service categories are as follows:
(i) Hardlines—consists of home appliances, consumer electronics, lawn & garden, tools & hardware,
automotive parts, household goods, toys, housewares and sporting goods;
(ii) Apparel and Soft Home—includes women's, men's, kids', footwear, jewelry, accessories and soft home;
(iii) Food and Drug—consists of grocery & household, pharmacy and drugstore;
(iv) Service—includes repair, installation and automotive service and extended contract revenue; and
(v) Other—includes revenues earned in connection with our agreements with SHO and Lands' End, as well as
credit revenues and licensed business revenues.
2015
millions Kmart
Sears
Domestic
Sears
Holdings
Merchandise sales and services:
Hardlines . . . . . . . . . . . . . . . . . . . . . . . . . . . . . . . . . . . . . . . . . . . . . . . . . . . . $2,936 $7,915 $10,851
Apparel and Soft Home . . . . . . . . . . . . . . . . . . . . . . . . . . . . . . . . . . . . . . . . . 3,434 2,907 6,341
Food and Drug . . . . . . . . . . . . . . . . . . . . . . . . . . . . . . . . . . . . . . . . . . . . . . . . 3,735 9 3,744
Service . . . . . . . . . . . . . . . . . . . . . . . . . . . . . . . . . . . . . . . . . . . . . . . . . . . . . . 13 2,127 2,140
Other . . . . . . . . . . . . . . . . . . . . . . . . . . . . . . . . . . . . . . . . . . . . . . . . . . . . . . . 70 2,000 2,070
Total merchandise sales and services . . . . . . . . . . . . . . . . . . . . . . . . . . . 10,188 14,958 25,146
Costs and expenses:
Cost of sales, buying and occupancy . . . . . . . . . . . . . . . . . . . . . . . . . . . . . . . 8,042 11,294 19,336
Selling and administrative . . . . . . . . . . . . . . . . . . . . . . . . . . . . . . . . . . . . . . . 2,537 4,320 6,857
Depreciation and amortization. . . . . . . . . . . . . . . . . . . . . . . . . . . . . . . . . . . . 72 350 422
Impairment charges . . . . . . . . . . . . . . . . . . . . . . . . . . . . . . . . . . . . . . . . . . . . 14 260 274
Gain on sales of assets . . . . . . . . . . . . . . . . . . . . . . . . . . . . . . . . . . . . . . . . . . (185)(558)(743)
Total costs and expenses. . . . . . . . . . . . . . . . . . . . . . . . . . . . . . . . . . . . . 10,480 15,666 26,146
Operating loss . . . . . . . . . . . . . . . . . . . . . . . . . . . . . . . . . . . . . . . . . . . . . . . . . . . . $(292) $ (708) $ (1,000)
Total assets . . . . . . . . . . . . . . . . . . . . . . . . . . . . . . . . . . . . . . . . . . . . . . . . . . . . . . $3,059 $8,278 $11,337
Capital expenditures . . . . . . . . . . . . . . . . . . . . . . . . . . . . . . . . . . . . . . . . . . . . . . . $42 $169 $211
SEARS HOLDINGS CORPORATION
Notes to Consolidated Financial Statements—(Continued)
104