Sears 2015 Annual Report Download - page 22
Download and view the complete annual report
Please find page 22 of the 2015 Sears annual report below. You can navigate through the pages in the report by either clicking on the pages listed below, or by using the keyword search tool below to find specific information within the annual report.-
 1
1 -
2
-
3
-
4
-
5
-
6
-
7
-
8
-
9
-
10
-
11
-
 12
12 -
 13
13 -
 14
14 -
 15
15 -
 16
16 -
 17
17 -
 18
18 -
 19
19 -
 20
20 -
 21
21 -
 22
22 -
 23
23 -
 24
24 -
 25
25 -
 26
26 -
 27
27 -
 28
28 -
 29
29 -
 30
30 -
 31
31 -
 32
32 -
33
-
34
-
35
-
36
-
37
-
38
-
39
-
40
-
41
-
42
-
43
-
44
-
45
-
46
-
47
-
48
-
49
-
50
-
51
-
52
-
53
-
54
-
55
-
56
-
57
-
58
-
59
-
60
-
61
-
62
-
63
-
64
-
65
-
66
-
67
-
68
-
69
-
70
-
71
-
72
-
73
-
74
-
75
-
76
-
77
-
78
-
79
-
80
-
81
-
82
-
83
-
84
-
85
-
86
-
87
-
88
-
89
-
90
-
91
-
92
-
93
-
94
-
95
-
96
-
97
-
98
-
99
-
100
-
101
-
102
-
103
-
104
-
105
-
106
-
107
-
108
-
109
-
110
-
111
-
112
-
113
-
114
-
115
-
116
-
117
-
118
-
119
-
120
-
121
-
122
-
123
-
124
-
125
-
126
-
127
-
128
-
129
-
130
-
131
-
132
 |
 |

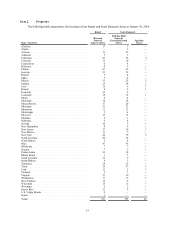
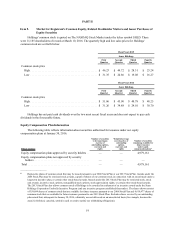
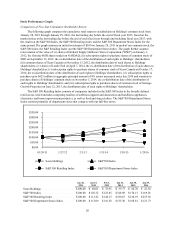
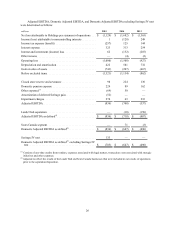
Item€6. Selected Financial Data
The table below summarizes our recent financial information. The data set forth below should be read in
conjunction with "Management's Discussion and Analysis of Financial Condition and Results of Operations" in
Item€7 and our Consolidated Financial Statements and notes thereto in Item€8.
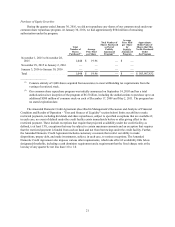
Fiscal
dollars in millions, except per share and store data 2015 2014 2013 2012 2011
Summary of Operations
Revenues(1). . . . . . . . . . . . . . . . . . . . . . . . . . . $25,146 $31,198 $36,188 $39,854 $41,567
Domestic comparable store sales % . . . . . . . (9.2)% (1.8)% (3.8)% (2.5)% (2.2)%
Net loss from continuing operations
attributable to Holdings' shareholders(2). . . (1,129)(1,682)(1,365)(930)(3,113)
Per Common Share
Basic:
Net loss from continuing operations
attributable to Holdings' shareholders . . . $(10.59) $ (15.82) $ (12.87) $ (8.78) $ (29.15)
Diluted:
Net loss from continuing operations
attributable to Holdings' shareholders . . . $(10.59) $ (15.82) $ (12.87) $ (8.78) $ (29.15)
Holdings' book value per common share. . . . $(18.40) $ (8.93) $ 16.34 $25.89 $40.26
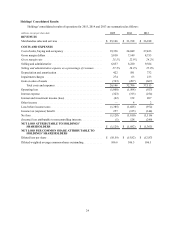
Financial Data
Total assets. . . . . . . . . . . . . . . . . . . . . . . . . . . $11,337 $13,185 $18,234 $19,320 $21,357
Long-term debt . . . . . . . . . . . . . . . . . . . . . . . 1,971 2,878 2,531 1,560 1,668
Long-term capital lease obligations. . . . . . . . 137 210 275 364 395
Capital expenditures . . . . . . . . . . . . . . . . . . . 211 270 329 378 432
Adjusted EBITDA(3) . . . . . . . . . . . . . . . . . . . (836)(718)(487)428 51
Domestic Adjusted EBITDA(3) . . . . . . . . . . . (836)(647)(490)359 (50)
Domestic Adjusted EBITDA excluding
Seritage/JV rent(3) . . . . . . . . . . . . . . . . . . . (703)(647)(490)359 (50)
Number of stores . . . . . . . . . . . . . . . . . . . . . . 1,672 1,725 2,429 2,548 4,010
_________________
€
(1) We follow a retail-based financial reporting calendar. Accordingly, the fiscal year ended February 2, 2013 contained 53
weeks, while all other years presented contained 52 weeks.
(2) The periods presented were impacted by certain significant items, which affected the comparability of amounts reflected in
the above selected financial data. For 2015, 2014 and 2013, these significant items are discussed within Item€7,
"Management's Discussion and Analysis of Financial Condition and Results of Operations." 2012 results include the
impact of non-cash charges of domestic pension settlements of $452 million, domestic pension expense of $103 million,
domestic store closings and severance of $109 million, domestic transaction costs of $6 million, domestic gain on the sales
of assets of $160 million and the results of the Lands' End, Sears Canada and Sears Hometown and Outlet businesses that
were included in the results of our operations prior to the respective separations of $50 million, $(51) million and $51
million, respectively. 2011 results include the impact of non-cash charges of $551 million related to the impairment of
goodwill balances, a $1.8 billion non-cash charge to establish a valuation allowance against our domestic deferred tax
assets, domestic pension expense of $46 million, store closings and severance of $225 million, mark-to-market losses of $3
million on Sears Canada hedge transactions, gain on the sale of real estate of $20 million, and hurricane losses of $7
million.
(3) See "Management's Discussion and Analysis of Financial Condition and Results of Operations" in Item€7 for a
reconciliation of this measure to GAAP and a discussion of management’s reasoning for using such measure.
22