Sears 2015 Annual Report Download - page 32
Download and view the complete annual report
Please find page 32 of the 2015 Sears annual report below. You can navigate through the pages in the report by either clicking on the pages listed below, or by using the keyword search tool below to find specific information within the annual report.-
 1
1 -
2
-
3
-
4
-
5
-
6
-
7
-
8
-
9
-
10
-
11
-
12
-
13
-
14
-
15
-
16
-
17
-
18
-
19
-
20
-
21
-
 22
22 -
 23
23 -
 24
24 -
 25
25 -
 26
26 -
 27
27 -
 28
28 -
 29
29 -
 30
30 -
 31
31 -
 32
32 -
 33
33 -
 34
34 -
 35
35 -
 36
36 -
 37
37 -
 38
38 -
 39
39 -
 40
40 -
 41
41 -
 42
42 -
43
-
44
-
45
-
46
-
47
-
48
-
49
-
50
-
51
-
52
-
53
-
54
-
55
-
56
-
57
-
58
-
59
-
60
-
61
-
62
-
63
-
64
-
65
-
66
-
67
-
68
-
69
-
70
-
71
-
72
-
73
-
74
-
75
-
76
-
77
-
78
-
79
-
80
-
81
-
82
-
83
-
84
-
85
-
86
-
87
-
88
-
89
-
90
-
91
-
92
-
93
-
94
-
95
-
96
-
97
-
98
-
99
-
100
-
101
-
102
-
103
-
104
-
105
-
106
-
107
-
108
-
109
-
110
-
111
-
112
-
113
-
114
-
115
-
116
-
117
-
118
-
119
-
120
-
121
-
122
-
123
-
124
-
125
-
126
-
127
-
128
-
129
-
130
-
131
-
132
 |
 |

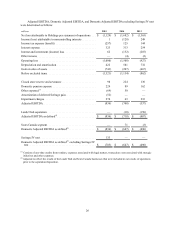
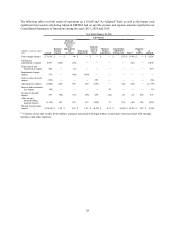
adjusted our results to reflect a standard effective tax rate for the Company beginning in fiscal 2011 when
the valuation allowance was first established.
• Gain on Sears Canada disposition – We recognized a gain upon de-consolidation of Sears Canada.
Management considers the gain to result from investing decisions rather than ongoing operations.
• Sears Canada segment – Reflects the results of the Sears Canada business that were included in our results
of operations prior to the disposition. The adjustment also includes the valuation allowance that was
recorded in the third quarter of 2014 prior to the de-consolidation of Sears Canada.
• Lands' End separation – Reflects the results of the Lands' End business that were included in our results of
operations prior to the separation.
• Seritage/JV rent – Reflects the impact of the additional rent expense and assigned sub-tenant income as a
result of the Seritage and joint venture transactions. The terms of our leases with Seritage and the joint
venture partners provide us with the ability to accelerate the transformation of our physical stores. We
expect that our cash rent obligation will decrease significantly as space in these stores is recaptured.
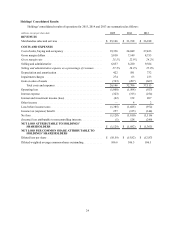
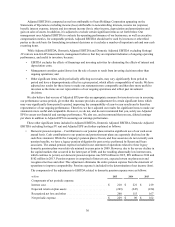
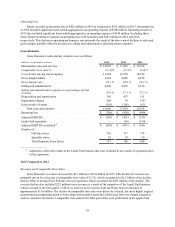
Revenues and Comparable Store Sales
Revenues decreased $6.1 billion, or 19.4%, to $25.1 billion in 2015, as compared to revenues of $31.2 billion
in 2014. Much of the decline related to actions we took during 2014 to streamline our operations and focus on our
transformation into a member-centric retailer. The decrease in revenue included a decrease of $2.1 billion associated
with Sears Canada, which was de-consolidated in October 2014, $222 million from the separation of the Lands’ End
business, which was completed on April 4, 2014, and $1.5 billion from fewer Kmart and Sears Full-line stores. In
addition, domestic comparable store sales declined 9.2%, which contributed to $2.0 billion of the decline. The
decline in comparable store sales was driven by reduced, but more highly targeted promotional and marketing spend
to better align with member needs and a shift away from low margin categories, such as consumer electronics.
Comparable store sales in the latter part of the year, particularly in the apparel and softlines businesses, were
negatively impacted by unseasonably warm weather and a highly promotional environment.
Kmart comparable store sales declined 7.3% with increases in the home appliances, mattresses and seasonal
categories, which were more than offset by declines in the consumer electronics, apparel, grocery & household and
drugstore categories. Excluding the impact of the consumer electronics business, which is a business we continue to
alter to meet our members' needs, Kmart comparable store sales would have decreased 5.5%. Sears Domestic
comparable store sales decreased 11.1%, and were also negatively impacted by consumer electronics. Excluding the
impact of consumer electronics, Sears Domestic comparable store sales would have decreased 9.5%, primarily
driven by decreases in apparel, home appliances, lawn & garden and Sears Auto Centers, which were partially offset
by an increase in the mattresses category.
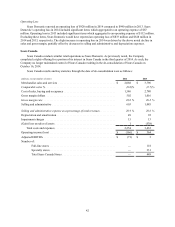
Gross Margin
Gross margin declined $1.3 billion to $5.8 billion in 2015 from $7.1 billion in 2014 as the above noted decline
in sales was partially offset by an improvement in gross margin rate. Gross margin for 2015 included one-time
vendor credits of $146 million, as well as a credit of $52 million related to the amortization of the deferred gain on
sale of assets associated with the Seritage transaction, while 2014 included gross margin of $502 million from Sears
Canada and $87 million from the Lands' End business. Gross margin for 2015 and 2014 also included charges of
$44 million and $68 million, respectively, related to store closures.
As compared to the prior year, Kmart's gross margin rate for 2015 declined 10 basis points, as increases
experienced in a majority of categories, most notably consumer electronics, grocery & household, drugstore and
toys, were more than offset by decreases in the apparel and pharmacy categories. Sears Domestic's gross margin rate
for 2015 improved 50 basis points. Excluding the impact of significant items, Sears Domestic's gross margin rate
declined 60 basis points, with the most notable decreases experienced in the apparel and home appliances categories
driven by an increase in promotional activities, particularly during the fourth quarter of 2015 as a result of the highly
competitive promotional environment.
In addition, as a result of the Seritage and JV transactions, 2015 included additional rent expense and assigned
sub-tenant income of approximately $133 million.
32