Sears 2015 Annual Report Download - page 35
Download and view the complete annual report
Please find page 35 of the 2015 Sears annual report below. You can navigate through the pages in the report by either clicking on the pages listed below, or by using the keyword search tool below to find specific information within the annual report.-
 1
1 -
2
-
3
-
4
-
5
-
6
-
7
-
8
-
9
-
10
-
11
-
12
-
13
-
14
-
15
-
16
-
17
-
18
-
19
-
20
-
21
-
22
-
23
-
24
-
 25
25 -
 26
26 -
 27
27 -
 28
28 -
 29
29 -
 30
30 -
 31
31 -
 32
32 -
 33
33 -
 34
34 -
 35
35 -
 36
36 -
 37
37 -
 38
38 -
 39
39 -
 40
40 -
 41
41 -
 42
42 -
 43
43 -
 44
44 -
 45
45 -
46
-
47
-
48
-
49
-
50
-
51
-
52
-
53
-
54
-
55
-
56
-
57
-
58
-
59
-
60
-
61
-
62
-
63
-
64
-
65
-
66
-
67
-
68
-
69
-
70
-
71
-
72
-
73
-
74
-
75
-
76
-
77
-
78
-
79
-
80
-
81
-
82
-
83
-
84
-
85
-
86
-
87
-
88
-
89
-
90
-
91
-
92
-
93
-
94
-
95
-
96
-
97
-
98
-
99
-
100
-
101
-
102
-
103
-
104
-
105
-
106
-
107
-
108
-
109
-
110
-
111
-
112
-
113
-
114
-
115
-
116
-
117
-
118
-
119
-
120
-
121
-
122
-
123
-
124
-
125
-
126
-
127
-
128
-
129
-
130
-
131
-
132
 |
 |

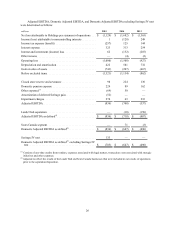
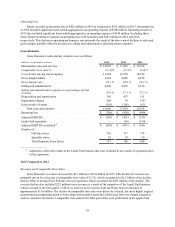
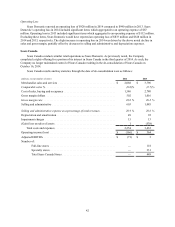
Gross Margin
Gross margin declined $1.6 billion to $7.1 billion in 2014 from $8.8 billion in 2013 due to the above noted
decline in revenues, as well as a decline in gross margin rate. Gross margin included significant items which
aggregated to $521 million and $1.6 billion for 2014 and 2013, respectively.
The gross margin rate for both Kmart and Sears Domestic for the year were impacted by transactions that offer
both traditional promotional marketing discounts and Shop Your Way® points, predominantly in the first half of the
year. As compared to the prior year, Kmart's gross margin rate decreased 50 basis points primarily driven by
decreases in home, consumer electronics and seasonal, which were partially offset by an improvement in the apparel
category. Sears Domestic's gross margin rate decreased 140 basis points in 2014 primarily driven by decreases in
apparel, tools, home and consumer electronics, partially offset by an improvement in mattresses.
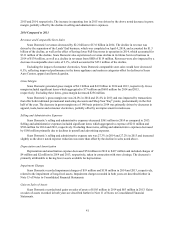
Selling and Administrative Expenses
Selling and administrative expenses decreased $1.2 billion to $8.2 billion in 2014 from $9.4 billion in 2013,
and included significant items which aggregated to expense of $945 million and $1.7 billion for 2014 and 2013,
respectively. Excluding these items, domestic selling and administrative expenses declined $394 million primarily
due to decreases in payroll and advertising expenses.
Selling and administrative expenses as a percentage of revenues ("selling and administrative expense rate")
were 26.3% and 25.9% for 2014 and 2013, respectively, and increased primarily as the decrease in overall selling
and administrative expenses was offset by lower expense leverage due to the above noted decline in revenues.
Impairment Charges
We recorded impairment charges of $63 million and $233 million in 2014 and 2013, respectively, related to the
impairment of long-lived assets as a result of store closings and impairment tests of our long-lived assets.
Impairment charges recorded in both years are described further in Note 13 of Notes to Consolidated Financial
Statements.
Gain on Sales of Assets
We recorded total gains on sales of assets of $207 million in 2014 and $667 million in 2013, which were
primarily attributable to several significant real estate transactions. Gains on sales of assets recorded in both years
are described further in Note 11 of Notes to Consolidated Financial Statements.
Operating Loss
We recorded an operating loss of $1.5 billion and $927 million in 2014 and 2013, respectively. The operating
loss for 2014 included significant items which aggregated to expense of $461 million. The operating loss for 2013
included significant items which aggregated to operating income of $108 million. Excluding these items, we would
have reported an operating loss of $1.0 billion in both 2014 and 2013.
Interest Expense
We incurred $313 million and $254 million in interest expense during 2014 and 2013, respectively. The
increase is due to an increase in average outstanding borrowings in 2014.
Interest and Investment Income
We recorded interest and investment income of $132 million and $207 million during 2014 and 2013,
respectively. Interest and investment income is described further in Note 6 of Notes to Consolidated Financial
Statements.
35