Sears 2015 Annual Report Download - page 24
Download and view the complete annual report
Please find page 24 of the 2015 Sears annual report below. You can navigate through the pages in the report by either clicking on the pages listed below, or by using the keyword search tool below to find specific information within the annual report.-
 1
1 -
2
-
3
-
4
-
5
-
6
-
7
-
8
-
9
-
10
-
11
-
12
-
13
-
 14
14 -
 15
15 -
 16
16 -
 17
17 -
 18
18 -
 19
19 -
 20
20 -
 21
21 -
 22
22 -
 23
23 -
 24
24 -
 25
25 -
 26
26 -
 27
27 -
 28
28 -
 29
29 -
 30
30 -
 31
31 -
 32
32 -
 33
33 -
 34
34 -
35
-
36
-
37
-
38
-
39
-
40
-
41
-
42
-
43
-
44
-
45
-
46
-
47
-
48
-
49
-
50
-
51
-
52
-
53
-
54
-
55
-
56
-
57
-
58
-
59
-
60
-
61
-
62
-
63
-
64
-
65
-
66
-
67
-
68
-
69
-
70
-
71
-
72
-
73
-
74
-
75
-
76
-
77
-
78
-
79
-
80
-
81
-
82
-
83
-
84
-
85
-
86
-
87
-
88
-
89
-
90
-
91
-
92
-
93
-
94
-
95
-
96
-
97
-
98
-
99
-
100
-
101
-
102
-
103
-
104
-
105
-
106
-
107
-
108
-
109
-
110
-
111
-
112
-
113
-
114
-
115
-
116
-
117
-
118
-
119
-
120
-
121
-
122
-
123
-
124
-
125
-
126
-
127
-
128
-
129
-
130
-
131
-
132
 |
 |

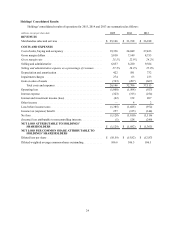
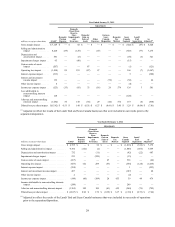
Holdings' Consolidated Results
Holdings' consolidated results of operations for 2015, 2014 and 2013 are summarized as follows:
millions, except per share data 2015 2014 2013
REVENUES
Merchandise sales and services . . . . . . . . . . . . . . . . . . . . . . . . . . . . . . . $25,146 $31,198 $36,188
COSTS AND EXPENSES
Cost of sales, buying and occupancy . . . . . . . . . . . . . . . . . . . . . . . . . . . 19,336 24,049 27,433
Gross margin dollars. . . . . . . . . . . . . . . . . . . . . . . . . . . . . . . . . . . . . . . . 5,810 7,149 8,755
Gross margin rate . . . . . . . . . . . . . . . . . . . . . . . . . . . . . . . . . . . . . . . . . . 23.1%22.9%24.2%
Selling and administrative . . . . . . . . . . . . . . . . . . . . . . . . . . . . . . . . . . . 6,857 8,220 9,384
Selling and administrative expense as a percentage of revenues . . . . . . 27.3%26.3%25.9%
Depreciation and amortization . . . . . . . . . . . . . . . . . . . . . . . . . . . . . . . . 422 581 732
Impairment charges . . . . . . . . . . . . . . . . . . . . . . . . . . . . . . . . . . . . . . . . 274 63 233
Gain on sales of assets . . . . . . . . . . . . . . . . . . . . . . . . . . . . . . . . . . . . . . (743)(207)(667)
Total costs and expenses . . . . . . . . . . . . . . . . . . . . . . . . . . . . . . . . . 26,146 32,706 37,115
Operating loss . . . . . . . . . . . . . . . . . . . . . . . . . . . . . . . . . . . . . . . . . . . . . (1,000)(1,508)(927)
Interest expense . . . . . . . . . . . . . . . . . . . . . . . . . . . . . . . . . . . . . . . . . . . (323)(313)(254)
Interest and investment income (loss) . . . . . . . . . . . . . . . . . . . . . . . . . . (62)132 207
Other income . . . . . . . . . . . . . . . . . . . . . . . . . . . . . . . . . . . . . . . . . . . . . —42
Loss before income taxes . . . . . . . . . . . . . . . . . . . . . . . . . . . . . . . . . . . . (1,385)(1,685)(972)
Income tax (expense) benefit . . . . . . . . . . . . . . . . . . . . . . . . . . . . . . . . . 257 (125)(144)
Net loss . . . . . . . . . . . . . . . . . . . . . . . . . . . . . . . . . . . . . . . . . . . . . . . . . . (1,128)(1,810)(1,116)
(Income) loss attributable to noncontrolling interests . . . . . . . . . . . . . . (1)128 (249)
NET LOSS ATTRIBUTABLE TO HOLDINGS’
SHAREHOLDERS . . . . . . . . . . . . . . . . . . . . . . . . . . . . . . . . . . . . $(1,129) $ (1,682) $ (1,365)
NET LOSS PER COMMON SHARE ATTRIBUTABLE TO
HOLDINGS’ SHAREHOLDERS
Diluted loss per share . . . . . . . . . . . . . . . . . . . . . . . . . . . . . . . . . . . . . . . $(10.59) $ (15.82) $ (12.87)
Diluted weighted average common shares outstanding . . . . . . . . . . . . . 106.6 106.3 106.1
24