Sears 2015 Annual Report Download - page 117
Download and view the complete annual report
Please find page 117 of the 2015 Sears annual report below. You can navigate through the pages in the report by either clicking on the pages listed below, or by using the keyword search tool below to find specific information within the annual report.-
 1
1 -
2
-
3
-
4
-
5
-
6
-
7
-
8
-
9
-
10
-
11
-
12
-
13
-
14
-
15
-
16
-
17
-
18
-
19
-
20
-
21
-
22
-
23
-
24
-
25
-
26
-
27
-
28
-
29
-
30
-
31
-
32
-
33
-
34
-
35
-
36
-
37
-
38
-
39
-
40
-
41
-
42
-
43
-
44
-
45
-
46
-
47
-
48
-
49
-
50
-
51
-
52
-
53
-
54
-
55
-
56
-
57
-
58
-
59
-
60
-
61
-
62
-
63
-
64
-
65
-
66
-
67
-
68
-
69
-
70
-
71
-
72
-
73
-
74
-
75
-
76
-
77
-
78
-
79
-
80
-
81
-
82
-
83
-
84
-
85
-
86
-
87
-
88
-
89
-
90
-
91
-
92
-
93
-
94
-
95
-
96
-
97
-
98
-
99
-
100
-
101
-
102
-
103
-
104
-
105
-
106
-
 107
107 -
 108
108 -
 109
109 -
 110
110 -
 111
111 -
 112
112 -
 113
113 -
 114
114 -
 115
115 -
 116
116 -
 117
117 -
 118
118 -
 119
119 -
 120
120 -
 121
121 -
 122
122 -
 123
123 -
 124
124 -
 125
125 -
 126
126 -
 127
127 -
128
-
129
-
130
-
131
-
132
 |
 |

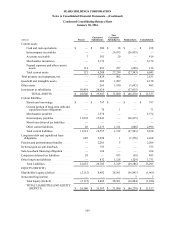
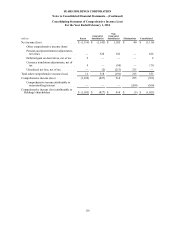
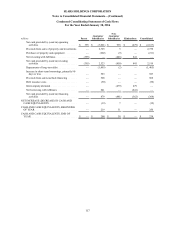
Condensed Consolidating Statement of Cash Flows
For the Year Ended January€30, 2016
€
millions Parent
Guarantor
Subsidiaries
Non-
Guarantor
Subsidiaries Eliminations Consolidated
Net cash provided by (used in) operating
activities . . . . . . . . . . . . . . . . . . . . . . . . . . . . . . $395 $(3,021) $ 938 $(479) $ (2,167)
Proceeds from sales of property and investments — 2,725 5 — 2,730
Purchases of property and equipment . . . . . . . . . — (202)(9)— (211)
Net investing with Affiliates . . . . . . . . . . . . . . . . (395)— (446)841 —
Net cash provided by (used in) investing
activities . . . . . . . . . . . . . . . . . . . . . . . . . . . . . . (395)2,523 (450)841 2,519
Repayments of long-term debt. . . . . . . . . . . . . . . — (1,403)(2)— (1,405)
Increase in short-term borrowings, primarily 90
days or less . . . . . . . . . . . . . . . . . . . . . . . . . . . . — 583 — — 583
Proceeds from sale-leaseback financing . . . . . . . — 508 — — 508
Debt issuance costs . . . . . . . . . . . . . . . . . . . . . . . — (50)— — (50)
Intercompany dividend. . . . . . . . . . . . . . . . . . . . . — (479)479 —
Net borrowing with Affiliates . . . . . . . . . . . . . . . — 841 — (841)—
Net cash provided by (used in) financing
activities . . . . . . . . . . . . . . . . . . . . . . . . . . . . . . — 479 (481)(362)(364)
NET INCREASE (DECREASE) IN CASH AND
CASH EQUIVALENTS. . . . . . . . . . . . . . . . . . . . . . — (19)7 — (12)
CASH AND CASH EQUIVALENTS, BEGINNING
OF YEAR. . . . . . . . . . . . . . . . . . . . . . . . . . . . . . . . . — 219 31 — 250
CASH AND CASH EQUIVALENTS, END OF
YEAR. . . . . . . . . . . . . . . . . . . . . . . . . . . . . . . . . . . . $—$200 $38 $—$238
€
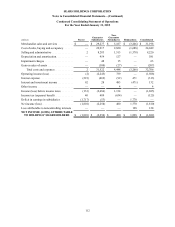
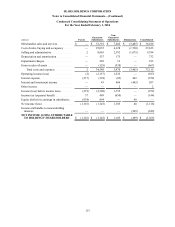
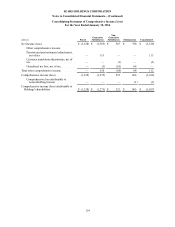
SEARS HOLDINGS CORPORATION
Notes to Consolidated Financial Statements—(Continued)
117