Sears 2015 Annual Report Download - page 109
Download and view the complete annual report
Please find page 109 of the 2015 Sears annual report below. You can navigate through the pages in the report by either clicking on the pages listed below, or by using the keyword search tool below to find specific information within the annual report.-
 1
1 -
2
-
3
-
4
-
5
-
6
-
7
-
8
-
9
-
10
-
11
-
12
-
13
-
14
-
15
-
16
-
17
-
18
-
19
-
20
-
21
-
22
-
23
-
24
-
25
-
26
-
27
-
28
-
29
-
30
-
31
-
32
-
33
-
34
-
35
-
36
-
37
-
38
-
39
-
40
-
41
-
42
-
43
-
44
-
45
-
46
-
47
-
48
-
49
-
50
-
51
-
52
-
53
-
54
-
55
-
56
-
57
-
58
-
59
-
60
-
61
-
62
-
63
-
64
-
65
-
66
-
67
-
68
-
69
-
70
-
71
-
72
-
73
-
74
-
75
-
76
-
77
-
78
-
79
-
80
-
81
-
82
-
83
-
84
-
85
-
86
-
87
-
88
-
89
-
90
-
91
-
92
-
93
-
94
-
95
-
96
-
97
-
98
-
 99
99 -
 100
100 -
 101
101 -
 102
102 -
 103
103 -
 104
104 -
 105
105 -
 106
106 -
 107
107 -
 108
108 -
 109
109 -
 110
110 -
 111
111 -
 112
112 -
 113
113 -
 114
114 -
 115
115 -
 116
116 -
 117
117 -
 118
118 -
 119
119 -
120
-
121
-
122
-
123
-
124
-
125
-
126
-
127
-
128
-
129
-
130
-
131
-
132
 |
 |

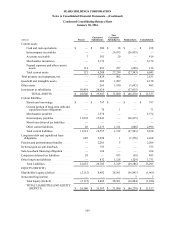
€Condensed Consolidating Balance Sheet
January€30, 2016
€
millions Parent
Guarantor
Subsidiaries
Non-
Guarantor
Subsidiaries Eliminations Consolidated
Current assets
Cash and cash equivalents . . . . . . . . . . $—$200 $38 $—$238
Intercompany receivables . . . . . . . . . . . — — 26,935 (26,935)—
Accounts receivable . . . . . . . . . . . . . . . 7 383 29 — 419
Merchandise inventories. . . . . . . . . . . . — 5,172 — — 5,172
Prepaid expenses and other current
assets . . . . . . . . . . . . . . . . . . . . . . . . . 114 453 257 (608)216
Total current assets . . . . . . . . . . . . . . . . 121 6,208 27,259 (27,543)6,045
Total property and equipment, net . . . . . . . . — 1,829 802 — 2,631
Goodwill and intangible assets . . . . . . . . . . — 269 1,909 — 2,178
Other assets . . . . . . . . . . . . . . . . . . . . . . . . . — 265 1,910 (1,692)483
Investment in subsidiaries . . . . . . . . . . . . . . 10,419 26,616 — (37,035)—
TOTAL ASSETS . . . . . . . . . . . . . . $10,540 $35,187 $31,880 $(66,270) $ 11,337
Current liabilities
Short-term borrowings . . . . . . . . . . . . . $—$797 $—$—$797
Current portion of long-term debt and
capitalized lease obligations . . . . . . . — 70 1 — 71
Merchandise payables. . . . . . . . . . . . . . — 1,574 — — 1,574
Intercompany payables . . . . . . . . . . . . . 11,892 15,043 — (26,935)—
Short-term deferred tax liabilities. . . . . —————
Other current liabilities . . . . . . . . . . . . . 20 2,273 1,311 (608)2,996
Total current liabilities . . . . . . . . . . . . . 11,912 19,757 1,312 (27,543)5,438
Long-term debt and capitalized lease
obligations . . . . . . . . . . . . . . . . . . . . . . . . 685 2,998 1 (1,576)2,108
Pension and postretirement benefits . . . . . . — 2,201 5 — 2,206
Deferred gain on sale-leaseback . . . . . . . . . — 753 — — 753
Sale-leaseback financing obligation . . . . . . — 164 — — 164
Long-term deferred tax liabilities . . . . . . . . 58 — 873 (38)893
Other long-term liabilities . . . . . . . . . . . . . . — 832 1,128 (229)1,731
Total Liabilities. . . . . . . . . . . . . . . . . . . 12,655 26,705 3,319 (29,386)13,293
EQUITY (DEFICIT)
Shareholder's equity (deficit) . . . . . . . . . . . . (2,115)8,482 28,561 (36,891)(1,963)
Noncontrolling interest . . . . . . . . . . . . . . . . — — — 7 7
Total Equity (Deficit) . . . . . . . . . . . . . . (2,115)8,482 28,561 (36,884)(1,956)
TOTAL LIABILITIES AND EQUITY
(DEFICIT). . . . . . . . . . . . . . . . . . . . . $10,540 $35,187 $31,880 $(66,270) $ 11,337
€
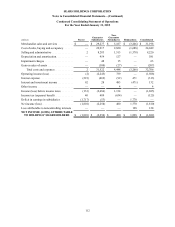
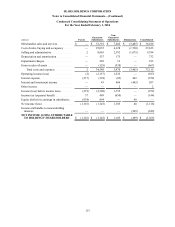
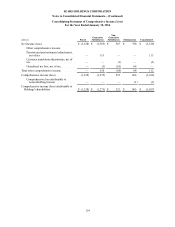
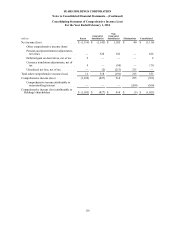
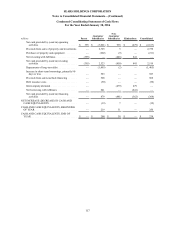
SEARS HOLDINGS CORPORATION
Notes to Consolidated Financial Statements—(Continued)
109