Sears 2015 Annual Report Download - page 43
Download and view the complete annual report
Please find page 43 of the 2015 Sears annual report below. You can navigate through the pages in the report by either clicking on the pages listed below, or by using the keyword search tool below to find specific information within the annual report.-
 1
1 -
2
-
3
-
4
-
5
-
6
-
7
-
8
-
9
-
10
-
11
-
12
-
13
-
14
-
15
-
16
-
17
-
18
-
19
-
20
-
21
-
22
-
23
-
24
-
25
-
26
-
27
-
28
-
29
-
30
-
31
-
32
-
 33
33 -
 34
34 -
 35
35 -
 36
36 -
 37
37 -
 38
38 -
 39
39 -
 40
40 -
 41
41 -
 42
42 -
 43
43 -
 44
44 -
 45
45 -
 46
46 -
 47
47 -
 48
48 -
 49
49 -
 50
50 -
 51
51 -
 52
52 -
 53
53 -
54
-
55
-
56
-
57
-
58
-
59
-
60
-
61
-
62
-
63
-
64
-
65
-
66
-
67
-
68
-
69
-
70
-
71
-
72
-
73
-
74
-
75
-
76
-
77
-
78
-
79
-
80
-
81
-
82
-
83
-
84
-
85
-
86
-
87
-
88
-
89
-
90
-
91
-
92
-
93
-
94
-
95
-
96
-
97
-
98
-
99
-
100
-
101
-
102
-
103
-
104
-
105
-
106
-
107
-
108
-
109
-
110
-
111
-
112
-
113
-
114
-
115
-
116
-
117
-
118
-
119
-
120
-
121
-
122
-
123
-
124
-
125
-
126
-
127
-
128
-
129
-
130
-
131
-
132
 |
 |

ANALYSIS OF CONSOLIDATED FINANCIAL CONDITION
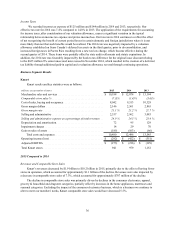
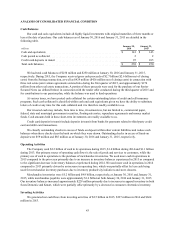
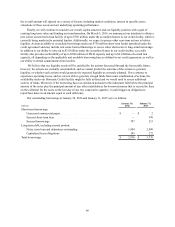
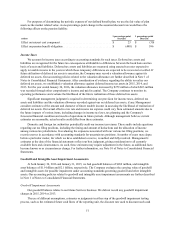
Cash Balances
Our cash and cash equivalents include all highly liquid investments with original maturities of three months or
less at the date of purchase. Our cash balances as of January€30, 2016 and January€31, 2015 are detailed in the
following table.
millions
January 30,
2016
January 31,
2015
Cash and equivalents . . . . . . . . . . . . . . . . . . . . . . . . . . . . . . . . . . . . . . . . . . . . . . . . . . . . $ 141 $ 143
Cash posted as collateral . . . . . . . . . . . . . . . . . . . . . . . . . . . . . . . . . . . . . . . . . . . . . . . . . 2 2
Credit card deposits in transit . . . . . . . . . . . . . . . . . . . . . . . . . . . . . . . . . . . . . . . . . . . . . 95 105
Total cash balances . . . . . . . . . . . . . . . . . . . . . . . . . . . . . . . . . . . . . . . . . . . . . . . . . . . . . $ 238 $ 250
We had total cash balances of $238 million and $250 million at January€30, 2016 and January€31, 2015,
respectively. During 2015, the Company received gross cash proceeds of $2.7 billion ($2.6 billion net of closing
costs) from the Seritage transaction, as well as $429 million ($426 million net of closing costs) in connection with
three real estate joint venture agreements entered into during the first quarter of 2015, and approximately $170
million from other real estate transactions. A portion of these proceeds were used for the purchase of our Senior
Secured Notes (as defined below) in connection with the tender offer conducted during the third quarter of 2015 and
for contributions to our pension plan, while the balance was used to fund operations.
At various times, we have posted cash collateral for certain outstanding letters of credit and self-insurance
programs. Such cash collateral is classified within cash and cash equivalents given we have the ability to substitute
letters of credit at any time for this cash collateral and it is therefore readily available to us.
Our invested cash may include, from time to time, investments in, but not limited to, commercial paper,
federal, state and municipal government securities, floating-rate notes, repurchase agreements and money market
funds. Cash amounts held in these short-term investments are readily available to us.
Credit card deposits in transit include deposits in transit from banks for payments related to third-party credit
card and debit card transactions.
We classify outstanding checks in excess of funds on deposit within other current liabilities and reduce cash
balances when these checks clear the bank on which they were drawn. Outstanding checks in excess of funds on
deposit were $59 million and $85 million as of January€30, 2016 and January€31, 2015, respectively.
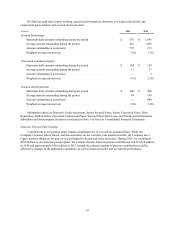
Operating Activities
The Company used $2.2 billion of cash in its operations during 2015, $1.4 billion during 2014 and $1.1 billion
during 2013. Our primary source of operating cash flows is the sale of goods and services to customers, while the
primary use of cash in operations is the purchase of merchandise inventories. We used more cash in operations in
2015 compared to the prior year primarily due to an increase in inventory balances experienced in 2015 as compared
to the significant decrease in inventory balances experienced during 2014. We used more cash in operations in 2014
compared to 2013 primarily driven by an increase in operating loss, which was partially offset by less cash being
used for merchandise inventory purchases due to inventory productivity initiatives and store closures.
Merchandise inventories were $5.2 billion and $4.9 billion, respectively, at January€30, 2016 and January€31,
2015, while merchandise payables were approximately $1.6 billion at both January€30, 2016 and January€31, 2015.
Our inventory balances increased approximately $229 million primarily due to increases in apparel inventory in both
Sears Domestic and Kmart, which were partially offset primarily by a decrease in consumer electronics inventory.
Investing Activities
We generated net cash flows from investing activities of $2.5 billion in 2015, $327 million in 2014 and $664
million in 2013.
43