Sears 2014 Annual Report Download - page 99
Download and view the complete annual report
Please find page 99 of the 2014 Sears annual report below. You can navigate through the pages in the report by either clicking on the pages listed below, or by using the keyword search tool below to find specific information within the annual report.-
 1
1 -
2
-
3
-
4
-
5
-
6
-
7
-
8
-
9
-
10
-
11
-
12
-
13
-
14
-
15
-
16
-
17
-
18
-
19
-
20
-
21
-
22
-
23
-
24
-
25
-
26
-
27
-
28
-
29
-
30
-
31
-
32
-
33
-
34
-
35
-
36
-
37
-
38
-
39
-
40
-
41
-
42
-
43
-
44
-
45
-
46
-
47
-
48
-
49
-
50
-
51
-
52
-
53
-
54
-
55
-
56
-
57
-
58
-
59
-
60
-
61
-
62
-
63
-
64
-
65
-
66
-
67
-
68
-
69
-
70
-
71
-
72
-
73
-
74
-
75
-
76
-
77
-
78
-
79
-
80
-
81
-
82
-
83
-
84
-
85
-
86
-
87
-
88
-
 89
89 -
 90
90 -
 91
91 -
 92
92 -
 93
93 -
 94
94 -
 95
95 -
 96
96 -
 97
97 -
 98
98 -
 99
99 -
 100
100 -
 101
101 -
 102
102 -
 103
103 -
 104
104 -
 105
105 -
 106
106 -
 107
107 -
 108
108 -
 109
109 -
110
-
111
-
112
-
113
-
114
-
115
-
116
-
117
-
118
-
119
-
120
-
121
-
122
-
123
-
124
-
125
-
126
-
127
-
128
-
129
-
130
-
131
-
132
-
133
-
134
-
135
-
136
-
137
-
138
-
139
-
140
-
141
-
142
-
143
 |
 |

SEARS HOLDINGS CORPORATION
Notes to Consolidated Financial Statements—(Continued)
99
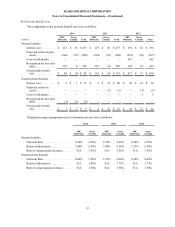
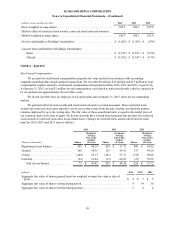
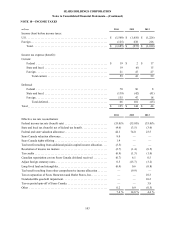
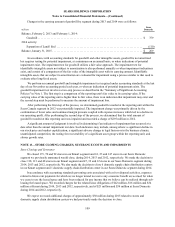
millions, except earnings per share 2014 2013 2012
Basic weighted average shares. . . . . . . . . . . . . . . . . . . . . . . . . . . . . . . . . . . . . . . 106.3 106.1 105.9
Dilutive effect of restricted stock awards, restricted stock units and warrants . . ———
Diluted weighted average shares . . . . . . . . . . . . . . . . . . . . . . . . . . . . . . . . . . . . . 106.3 106.1 105.9
Net loss attributable to Holdings' shareholders . . . . . . . . . . . . . . . . . . . . . . . . . . $(1,682) $ (1,365) $ (930)
Loss per share attributable to Holdings' shareholders:
Basic . . . . . . . . . . . . . . . . . . . . . . . . . . . . . . . . . . . . . . . . . . . . . . . . . . . . . . . $(15.82) $ (12.87) $ (8.78)
Diluted . . . . . . . . . . . . . . . . . . . . . . . . . . . . . . . . . . . . . . . . . . . . . . . . . . . . . $(15.82) $ (12.87) $ (8.78)
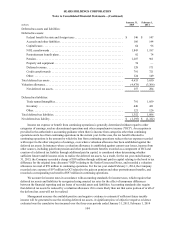
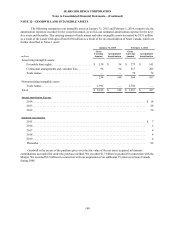
NOTE 9—EQUITY
Stock-based Compensation
We account for stock-based compensation using the fair value method in accordance with accounting
standards regarding share-based payment transactions. We recorded $8 million, $12 million and $15 million in total
compensation expense related to stock-based compensation arrangements during 2014, 2013 and 2012, respectively.
At January 31, 2015, we had $1 million in total compensation cost related to nonvested awards, which is expected to
be recognized over approximately the next three years.
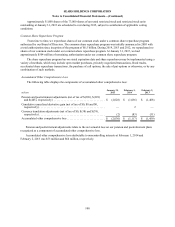
We do not currently have an employee stock option plan and at January 31, 2015, there are no outstanding
options.
We granted restricted stock awards and restricted stock units to certain associates. These restricted stock
awards and restricted stock units typically vest in zero to three years from the date of grant, provided the grantee
remains employed by us at the vesting date. The fair value of these awards and units is equal to the market price of
our common stock on the date of grant. We do not currently have a broad-based program that provides for restricted
stock awards or restricted stock units on an annual basis. Changes in restricted stock awards and restricted stock
units for 2014, 2013 and 2012 were as follows:
2014 2013 2012
(Shares in thousands) Shares
Weighted-
Average
Fair Value
on Date
of Grant Shares
Weighted-
Average
Fair Value
on Date
of Grant Shares
Weighted-
Average
Fair Value
on Date
of Grant
Beginning of year balance. . . . . . . . . . . . . . 205 $ 48.24 424 $ 57.72 496 $ 65.02
Granted . . . . . . . . . . . . . . . . . . . . . . . . . . . . 168 38.35 135 49.19 175 49.20
Vested . . . . . . . . . . . . . . . . . . . . . . . . . . . . . (248) 41.17 (281) 57.71 (172) 60.89
Forfeited . . . . . . . . . . . . . . . . . . . . . . . . . . . (52) 53.44 (73) 68.47 (75) 78.59
End of year balance . . . . . . . . . . . . . . . 73 $ 45.82 205 $ 48.24 424 $ 57.72
millions 2014 2013 2012
Aggregate fair value of shares granted based on weighted average fair value at date of
grant . . . . . . . . . . . . . . . . . . . . . . . . . . . . . . . . . . . . . . . . . . . . . . . . . . . . . . . . . . . . . . . . . . $ 6 $ 7 $ 9
Aggregate fair value of shares vesting during period . . . . . . . . . . . . . . . . . . . . . . . . . . . . . . 9 14 10
Aggregate fair value of shares forfeited during period . . . . . . . . . . . . . . . . . . . . . . . . . . . . . 244