Sears 2014 Annual Report Download - page 116
Download and view the complete annual report
Please find page 116 of the 2014 Sears annual report below. You can navigate through the pages in the report by either clicking on the pages listed below, or by using the keyword search tool below to find specific information within the annual report.-
 1
1 -
2
-
3
-
4
-
5
-
6
-
7
-
8
-
9
-
10
-
11
-
12
-
13
-
14
-
15
-
16
-
17
-
18
-
19
-
20
-
21
-
22
-
23
-
24
-
25
-
26
-
27
-
28
-
29
-
30
-
31
-
32
-
33
-
34
-
35
-
36
-
37
-
38
-
39
-
40
-
41
-
42
-
43
-
44
-
45
-
46
-
47
-
48
-
49
-
50
-
51
-
52
-
53
-
54
-
55
-
56
-
57
-
58
-
59
-
60
-
61
-
62
-
63
-
64
-
65
-
66
-
67
-
68
-
69
-
70
-
71
-
72
-
73
-
74
-
75
-
76
-
77
-
78
-
79
-
80
-
81
-
82
-
83
-
84
-
85
-
86
-
87
-
88
-
89
-
90
-
91
-
92
-
93
-
94
-
95
-
96
-
97
-
98
-
99
-
100
-
101
-
102
-
103
-
104
-
105
-
 106
106 -
 107
107 -
 108
108 -
 109
109 -
 110
110 -
 111
111 -
 112
112 -
 113
113 -
 114
114 -
 115
115 -
 116
116 -
 117
117 -
 118
118 -
 119
119 -
 120
120 -
 121
121 -
 122
122 -
 123
123 -
 124
124 -
 125
125 -
 126
126 -
127
-
128
-
129
-
130
-
131
-
132
-
133
-
134
-
135
-
136
-
137
-
138
-
139
-
140
-
141
-
142
-
143
 |
 |

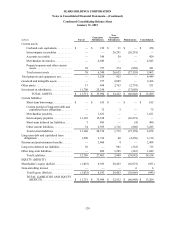
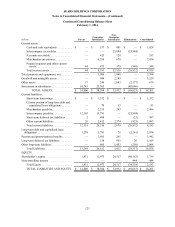
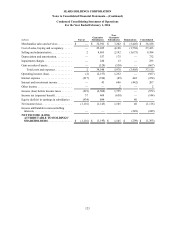
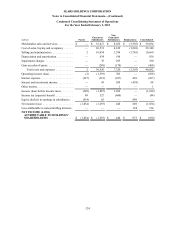
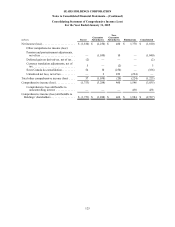
SEARS HOLDINGS CORPORATION
Notes to Consolidated Financial Statements—(Continued)
116
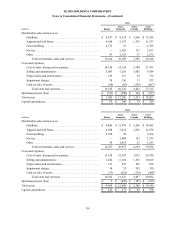
2013
millions Kmart Sears
Domestic Sears
Canada Sears
Holdings
Merchandise sales and services:
Hardlines. . . . . . . . . . . . . . . . . . . . . . . . . . . . . . . . . . . . . . . . . . . $ 4,037 $ 9,355 $ 1,866 $ 15,258
Apparel and Soft Home . . . . . . . . . . . . . . . . . . . . . . . . . . . . . . . 4,298 5,197 1,742 11,237
Food and Drug . . . . . . . . . . . . . . . . . . . . . . . . . . . . . . . . . . . . . . 4,772 16 — 4,788
Service . . . . . . . . . . . . . . . . . . . . . . . . . . . . . . . . . . . . . . . . . . . . — 2,502 131 2,633
Other . . . . . . . . . . . . . . . . . . . . . . . . . . . . . . . . . . . . . . . . . . . . . . 87 2,128 57 2,272
Total merchandise sales and services . . . . . . . . . . . . . . . . . 13,194 19,198 3,796 36,188
Costs and expenses:
Cost of sales, buying and occupancy . . . . . . . . . . . . . . . . . . . . . 10,329 14,324 2,780 27,433
Selling and administrative . . . . . . . . . . . . . . . . . . . . . . . . . . . . . 3,083 5,216 1,085 9,384
Depreciation and amortization . . . . . . . . . . . . . . . . . . . . . . . . . . 129 511 92 732
Impairment charges . . . . . . . . . . . . . . . . . . . . . . . . . . . . . . . . . . 70 150 13 233
Gain on sales of assets . . . . . . . . . . . . . . . . . . . . . . . . . . . . . . . . (66)(63)(538)(667)
Total costs and expenses . . . . . . . . . . . . . . . . . . . . . . . . . . . 13,545 20,138 3,432 37,115
Operating income (loss). . . . . . . . . . . . . . . . . . . . . . . . . . . . . . . . . . . $(351) $ (940) $ 364 $ (927)
Total assets. . . . . . . . . . . . . . . . . . . . . . . . . . . . . . . . . . . . . . . . . . . . . $ 3,902 $ 12,206 $ 2,153 $ 18,261
Capital expenditures. . . . . . . . . . . . . . . . . . . . . . . . . . . . . . . . . . . . . . $ 63 $ 196 $ 70 $ 329
2012
millions Kmart Sears
Domestic Sears
Canada Sears
Holdings
Merchandise sales and services:
Hardlines. . . . . . . . . . . . . . . . . . . . . . . . . . . . . . . . . . . . . . . . . . . $ 4,486 $ 11,870 $ 2,246 $ 18,602
Apparel and Soft Home . . . . . . . . . . . . . . . . . . . . . . . . . . . . . . . 4,588 5,434 1,856 11,878
Food and Drug . . . . . . . . . . . . . . . . . . . . . . . . . . . . . . . . . . . . . . 5,398 38 — 5,436
Service . . . . . . . . . . . . . . . . . . . . . . . . . . . . . . . . . . . . . . . . . . . . — 2,604 151 2,755
Other . . . . . . . . . . . . . . . . . . . . . . . . . . . . . . . . . . . . . . . . . . . . . . 95 1,031 57 1,183
Total merchandise sales and services . . . . . . . . . . . . . . . . . 14,567 20,977 4,310 39,854
Costs and expenses:
Cost of sales, buying and occupancy . . . . . . . . . . . . . . . . . . . . . 11,158 15,107 3,075 29,340
Selling and administrative . . . . . . . . . . . . . . . . . . . . . . . . . . . . . 3,284 6,184 1,192 10,660
Depreciation and amortization . . . . . . . . . . . . . . . . . . . . . . . . . . 147 578 105 830
Impairment charges . . . . . . . . . . . . . . . . . . . . . . . . . . . . . . . . . . 10 25 295 330
Gain on sales of assets . . . . . . . . . . . . . . . . . . . . . . . . . . . . . . . . (37)(261)(170)(468)
Total costs and expenses . . . . . . . . . . . . . . . . . . . . . . . . . . . 14,562 21,633 4,497 40,692
Operating income (loss). . . . . . . . . . . . . . . . . . . . . . . . . . . . . . . . . . . $ 5 $ (656) $ (187) $ (838)
Total assets. . . . . . . . . . . . . . . . . . . . . . . . . . . . . . . . . . . . . . . . . . . . . $ 4,304 $ 12,648 $ 2,388 $ 19,340
Capital expenditures. . . . . . . . . . . . . . . . . . . . . . . . . . . . . . . . . . . . . . $ 122 $ 171 $ 85 $ 378