Sears 2014 Annual Report Download - page 118
Download and view the complete annual report
Please find page 118 of the 2014 Sears annual report below. You can navigate through the pages in the report by either clicking on the pages listed below, or by using the keyword search tool below to find specific information within the annual report.-
 1
1 -
2
-
3
-
4
-
5
-
6
-
7
-
8
-
9
-
10
-
11
-
12
-
13
-
14
-
15
-
16
-
17
-
18
-
19
-
20
-
21
-
22
-
23
-
24
-
25
-
26
-
27
-
28
-
29
-
30
-
31
-
32
-
33
-
34
-
35
-
36
-
37
-
38
-
39
-
40
-
41
-
42
-
43
-
44
-
45
-
46
-
47
-
48
-
49
-
50
-
51
-
52
-
53
-
54
-
55
-
56
-
57
-
58
-
59
-
60
-
61
-
62
-
63
-
64
-
65
-
66
-
67
-
68
-
69
-
70
-
71
-
72
-
73
-
74
-
75
-
76
-
77
-
78
-
79
-
80
-
81
-
82
-
83
-
84
-
85
-
86
-
87
-
88
-
89
-
90
-
91
-
92
-
93
-
94
-
95
-
96
-
97
-
98
-
99
-
100
-
101
-
102
-
103
-
104
-
105
-
106
-
107
-
 108
108 -
 109
109 -
 110
110 -
 111
111 -
 112
112 -
 113
113 -
 114
114 -
 115
115 -
 116
116 -
 117
117 -
 118
118 -
 119
119 -
 120
120 -
 121
121 -
 122
122 -
 123
123 -
 124
124 -
 125
125 -
 126
126 -
 127
127 -
 128
128 -
129
-
130
-
131
-
132
-
133
-
134
-
135
-
136
-
137
-
138
-
139
-
140
-
141
-
142
-
143
 |
 |

SEARS HOLDINGS CORPORATION
Notes to Consolidated Financial Statements—(Continued)
118
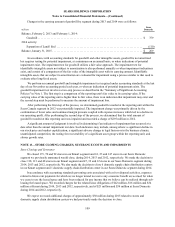
2013
millions, except per share data First
Quarter Second
Quarter Third
Quarter Fourth
Quarter
Revenues. . . . . . . . . . . . . . . . . . . . . . . . . . . . . . . . . . . . . . . . $ 8,452 $ 8,871 $ 8,272 $ 10,593
Cost of sales, buying and occupancy . . . . . . . . . . . . . . . . . . 6,296 6,685 6,341 8,111
Selling and administrative . . . . . . . . . . . . . . . . . . . . . . . . . . 2,218 2,291 2,262 2,613
Net loss attributable to Holdings' shareholders . . . . . . . . . . (279)(194)(534)(358)
Basic net loss per share attributable to Holdings'
shareholders. . . . . . . . . . . . . . . . . . . . . . . . . . . . . . . . . . . (2.63)(1.83)(5.03)(3.37)
Diluted net loss per share attributable to Holdings'
shareholders. . . . . . . . . . . . . . . . . . . . . . . . . . . . . . . . . . . (2.63)(1.83)(5.03)(3.37)
Per share amounts for each quarter are required to be computed independently and may not equal the amount
computed for the total year.
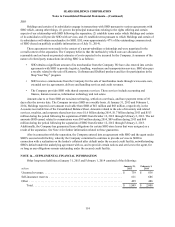
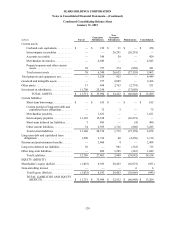
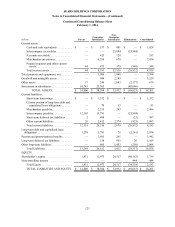
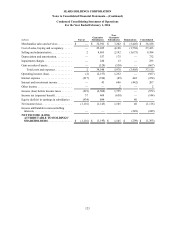
NOTE 20—GUARANTOR/NON-GUARANTOR SUBSIDIARY FINANCIAL INFORMATION
At January 31, 2015, the principal amount outstanding of the Company’s 6 5/8% senior secured notes due 2018
was $1.24 billion. These notes were issued in 2010 by Sears Holdings Corporation ("Parent"). The Senior Secured
Notes are guaranteed by certain of our 100% owned domestic subsidiaries that own the collateral for the Senior
Secured Notes, as well as by Sears Holdings Management Corporation and SRAC (the "guarantor subsidiaries").
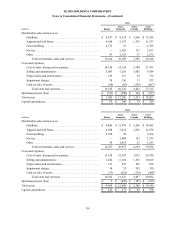
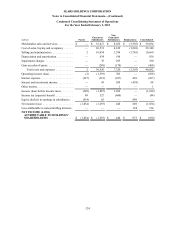
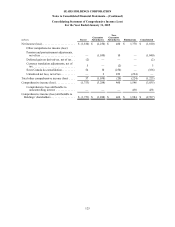
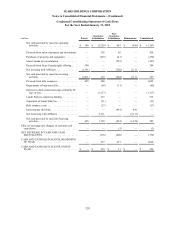
The following condensed consolidated financial information presents the Condensed Consolidating Balance Sheets
at January 31, 2015 and February 1, 2014, and the Condensed Consolidating Statements of Operations, the
Consolidating Statements of Comprehensive Income (Loss) and the Condensed Consolidating Statements of Cash
flows for 2014, 2013 and 2012 of (i) Parent; (ii) the guarantor subsidiaries; (iii) the non-guarantor subsidiaries;
(iv) eliminations and (v) the Company on a consolidated basis.
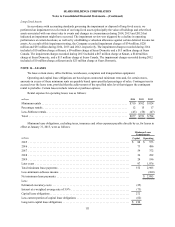
On April 4, 2014, we completed the separation of our Lands' End business through a spin-off transaction. The
following condensed consolidated financial statements had total assets and liabilities of approximately $1.1 billion
and $385 million, respectively, at February 1, 2014, attributable to the Lands' End domestic business. Merchandise
sales and services included revenues of approximately $183 million, $1.3 billion and $1.3 billion from the Lands'
End domestic business in 2014, 2013 and 2012, respectively. Net loss attributable to Holdings' shareholders included
net income of approximately $2 million, $70 million and $37 million from the Lands' End domestic business in
2014, 2013 and 2012, respectively. The financial information for the domestic portion of Lands' End business is
reflected within the guarantor subsidiaries balances for these periods, while the international portion is reflected
within the non-guarantor subsidiaries balances for these periods.
On October 16, 2014, we de-consolidated Sears Canada pursuant to a rights offering transaction. The
following condensed consolidated financial statements had total assets and liabilities of approximately $2.2 billion
and $1.3 billion, respectively, at February 1, 2014 attributable to Sears Canada. Merchandise sales and services
included revenues of approximately $2.1 billion, $3.8 billion and $4.3 billion in 2014, 2013 and 2012, respectively.
Net loss attributable to Holdings' shareholders included net loss of approximately $137 million in 2014, net income
of approximately $244 million in 2013 and net loss of approximately $51 million in 2012. The financial information
for Sears Canada is reflected within the non-guarantor subsidiaries balances for these periods.
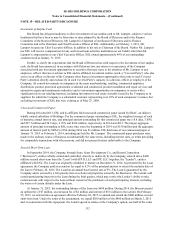
Merchandise sales and services included revenues of $1.7 billion from SHO for 2012. Net income (loss)
attributable to Holdings' shareholders included net income of approximately $51 million from SHO for 2012. The
financial information for SHO is reflected within the guarantor subsidiaries balances for the period. The condensed
consolidated financial information as of and for the periods ended January 31, 2015, February 1, 2014 and
February 2, 2013 reflects the effects of the separation of SHO.
The principal elimination entries relate to investments in subsidiaries and intercompany balances and
transactions including transactions with our wholly-owned non-guarantor insurance subsidiary. The Company has
accounted for investments in subsidiaries under the equity method. The guarantor subsidiaries are 100% owned
directly or indirectly by the Parent and all guarantees are joint, several and unconditional. Additionally, the notes are