Sears 2014 Annual Report Download - page 31
Download and view the complete annual report
Please find page 31 of the 2014 Sears annual report below. You can navigate through the pages in the report by either clicking on the pages listed below, or by using the keyword search tool below to find specific information within the annual report.-
 1
1 -
2
-
3
-
4
-
5
-
6
-
7
-
8
-
9
-
10
-
11
-
12
-
13
-
14
-
15
-
16
-
17
-
18
-
19
-
20
-
 21
21 -
 22
22 -
 23
23 -
 24
24 -
 25
25 -
 26
26 -
 27
27 -
 28
28 -
 29
29 -
 30
30 -
 31
31 -
 32
32 -
 33
33 -
 34
34 -
 35
35 -
 36
36 -
 37
37 -
 38
38 -
 39
39 -
 40
40 -
 41
41 -
42
-
43
-
44
-
45
-
46
-
47
-
48
-
49
-
50
-
51
-
52
-
53
-
54
-
55
-
56
-
57
-
58
-
59
-
60
-
61
-
62
-
63
-
64
-
65
-
66
-
67
-
68
-
69
-
70
-
71
-
72
-
73
-
74
-
75
-
76
-
77
-
78
-
79
-
80
-
81
-
82
-
83
-
84
-
85
-
86
-
87
-
88
-
89
-
90
-
91
-
92
-
93
-
94
-
95
-
96
-
97
-
98
-
99
-
100
-
101
-
102
-
103
-
104
-
105
-
106
-
107
-
108
-
109
-
110
-
111
-
112
-
113
-
114
-
115
-
116
-
117
-
118
-
119
-
120
-
121
-
122
-
123
-
124
-
125
-
126
-
127
-
128
-
129
-
130
-
131
-
132
-
133
-
134
-
135
-
136
-
137
-
138
-
139
-
140
-
141
-
142
-
143
 |
 |

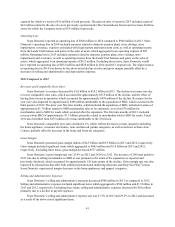
31
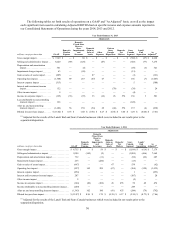
Year Ended February 2, 2013
Adjustments
millions, except per share data GAAP
Domestic
Pension
Expense
Domestic
Closed Store
Reserve, Store
Impairments
and Severance
Domestic
Gain on
Sales of
Assets
Domestic
Transaction
Costs
Domestic
Pension
Settlements
Domestic
Tax
Matters
Sears
Canada
Segment Lands' End
Separation SHO
Separation As
Adjusted(2)
Gross margin impact . . . . . . . . . . . . . . . . . . . $10,514 $ — $ 35 $ — $ — $ — $ — $ (1,235) $ (606) $ (432) $ 8,276
Selling and administrative impact. . . . . . . . . 10,660 (165) (83) — (9) (452) — (1,192) (501) (343) 7,915
Depreciation and amortization impact . . . . . 830 — (22) — — — — (105) (23) (6) 674
Impairment charges impact . . . . . . . . . . . . . . 330 — (35) — — — — (295) — — —
Gain on sales of assets impact. . . . . . . . . . . . (468) — — 256 — — — 170 — — (42)
Operating loss impact . . . . . . . . . . . . . . . . . . (838) 165 175 (256) 9 452 — 187 (82) (83)(271)
Interest expense impact . . . . . . . . . . . . . . . . . (267) — — — — — — 9 — — (258)
Interest and investment income impact. . . . . 94 — — — — — — (51) — — 43
Other income impact . . . . . . . . . . . . . . . . . . . 1 — — — — — — (2) — — (1)
Income tax expense impact . . . . . . . . . . . . . . (44) (62) (66) 96 (3) — 164 32 32 33 182
Loss attributable to noncontrolling interests
impact . . . . . . . . . . . . . . . . . . . . . . . . . . . . 124 — — — — — — (124) — — —
After tax and noncontrolling interest impact.(930) 103 109 (160) 6 452 164 51 (50) (51)(306)
Diluted loss per share impact . . . . . . . . . . . . $ (8.78) $ 0.97 $ 1.03 $ (1.51) $ 0.06 $ 4.27 $ 1.55 $ 0.48 $ (0.47) $ (0.48) $ (2.88)
(2) Adjusted to reflect the results of the Lands' End, Sears Canada and Sears Hometown and Outlet businesses that were included
in our results of operations prior to the respective separations.
We also believe that our use of Adjusted EPS provides an appropriate measure for investors to use in assessing
our performance across periods, given that this measure provides an adjustment for certain significant items which
may vary significantly from period to period, improving the comparability of year-to-year results and is therefore
representative of our ongoing performance. Therefore, we have adjusted our results for them to make our statements
more useful and comparable. However, we do not, and do not recommend that you, solely use Adjusted EPS to
assess our financial and earnings performance. We also use, and recommend that you use, diluted earnings per share
in addition to Adjusted EPS in assessing our earnings performance.
In addition to the significant items included in the Adjusted EBITDA calculation, Adjusted EPS includes the
following other significant items which, while periodically affecting our results, may vary significantly from period
to period and have a disproportionate effect in a given period, and affects comparability of results.
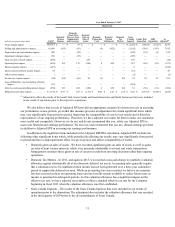
• Domestic gains on sales of assets - We have recorded significant gains on sales of assets, as well as gains
on sales of joint venture interests, which were primarily attributable to several real estate transactions.
Management considers these gains on sale of assets to result from investing decisions rather than ongoing
operations.
• Domestic Tax Matters - In 2011, and again in 2013, we recorded a non-cash charge to establish a valuation
allowance against substantially all of our domestic deferred tax assets. Accounting rules generally require
that a valuation reserve be established when income has not been generated over a three-year cumulative
period to support the deferred tax asset. While an accounting loss was recorded, we believe no economic
loss has occurred as these net operating losses and tax benefits remain available to reduce future taxes as
income is generated in subsequent periods. As this valuation allowance has a significant impact on the
effective tax rate, we have adjusted our results to reflect a standard effective tax rate for the Company
beginning in fiscal 2011 when the valuation allowance was first established.
• Sears Canada Segment - The results of the Sears Canada business that were included in our results of
operations prior to the disposition. The adjustment also includes the valuation allowance that was recorded
in the third quarter of 2014 prior to the de-consolidation of Sears Canada.