Sears 2014 Annual Report Download - page 39
Download and view the complete annual report
Please find page 39 of the 2014 Sears annual report below. You can navigate through the pages in the report by either clicking on the pages listed below, or by using the keyword search tool below to find specific information within the annual report.-
 1
1 -
2
-
3
-
4
-
5
-
6
-
7
-
8
-
9
-
10
-
11
-
12
-
13
-
14
-
15
-
16
-
17
-
18
-
19
-
20
-
21
-
22
-
23
-
24
-
25
-
26
-
27
-
28
-
 29
29 -
 30
30 -
 31
31 -
 32
32 -
 33
33 -
 34
34 -
 35
35 -
 36
36 -
 37
37 -
 38
38 -
 39
39 -
 40
40 -
 41
41 -
 42
42 -
 43
43 -
 44
44 -
 45
45 -
 46
46 -
 47
47 -
 48
48 -
 49
49 -
50
-
51
-
52
-
53
-
54
-
55
-
56
-
57
-
58
-
59
-
60
-
61
-
62
-
63
-
64
-
65
-
66
-
67
-
68
-
69
-
70
-
71
-
72
-
73
-
74
-
75
-
76
-
77
-
78
-
79
-
80
-
81
-
82
-
83
-
84
-
85
-
86
-
87
-
88
-
89
-
90
-
91
-
92
-
93
-
94
-
95
-
96
-
97
-
98
-
99
-
100
-
101
-
102
-
103
-
104
-
105
-
106
-
107
-
108
-
109
-
110
-
111
-
112
-
113
-
114
-
115
-
116
-
117
-
118
-
119
-
120
-
121
-
122
-
123
-
124
-
125
-
126
-
127
-
128
-
129
-
130
-
131
-
132
-
133
-
134
-
135
-
136
-
137
-
138
-
139
-
140
-
141
-
142
-
143
 |
 |

39
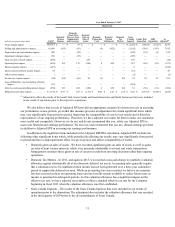
Gain on Sales of Assets
Kmart recorded total gains on sales of assets of $66 million and $37 million in 2013 and 2012, respectively.
The gain on sales of assets in 2013 included gains of $24 million related to the sale of two stores for which the
Company received $24 million in cash proceeds. The gains on sales of assets in 2012 included a gain of $11 million
recognized on the sale of one store.
Operating Income (Loss)
Kmart recorded an operating loss of $351 million in 2013 as compared to operating income of $5 million in
2012. Operating loss in 2013 included expenses related to store closings, store impairments and severance, as well
as gains on the sales of assets which aggregated to an operating loss of $144 million. Operating income in 2012 also
included expenses related to store closings, store impairments and severance, as well as gains on sales of assets
which aggregated to an operating loss of $84 million. Excluding these items, Kmart would have reported an
operating loss of $207 million in 2013 as compared to operating income of $89 million in 2012. This decline in
operating performance was primarily the result of the above noted declines in sales and gross margin, partially offset
by a decrease in selling and administrative expenses.
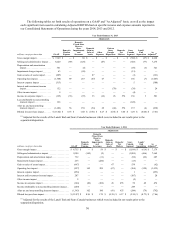
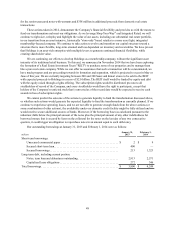
Sears Domestic
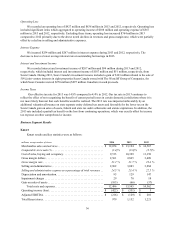
Sears Domestic results and key statistics were as follows:
millions, except number of stores 2014 2013 2012
Merchandise sales and services. . . . . . . . . . . . . . . . . . . . . . . . . . . . . . . . $ 17,036 $ 19,198 $ 20,977
Comparable store sales %. . . . . . . . . . . . . . . . . . . . . . . . . . . . . . . . . . . . (2.1)% (4.1)% (1.4)%
Cost of sales, buying and occupancy. . . . . . . . . . . . . . . . . . . . . . . . . . . . 12,950 14,324 15,107
Gross margin dollars . . . . . . . . . . . . . . . . . . . . . . . . . . . . . . . . . . . . . . . . 4,086 4,874 5,870
Gross margin rate . . . . . . . . . . . . . . . . . . . . . . . . . . . . . . . . . . . . . . . . . . 24.0 % 25.4 % 28.0 %
Selling and administrative. . . . . . . . . . . . . . . . . . . . . . . . . . . . . . . . . . . . 4,655 5,216 6,184
Selling and administrative expense as a percentage of total revenues . . 27.3 % 27.2 % 29.5 %
Depreciation and amortization . . . . . . . . . . . . . . . . . . . . . . . . . . . . . . . . 437 511 578
Impairment charges . . . . . . . . . . . . . . . . . . . . . . . . . . . . . . . . . . . . . . . . . 19 150 25
Gain on sales of assets. . . . . . . . . . . . . . . . . . . . . . . . . . . . . . . . . . . . . . . (105) (63) (261)
Total costs and expenses. . . . . . . . . . . . . . . . . . . . . . . . . . . . . . . . . . 17,956 20,138 21,633
Operating loss . . . . . . . . . . . . . . . . . . . . . . . . . . . . . . . . . . . . . . . . . . . . . $ (920) $ (940) $ (656)
Adjusted EBITDA. . . . . . . . . . . . . . . . . . . . . . . . . . . . . . . . . . . . . . . . . . $ (421) $ (211) $ 356
Lands' End separation . . . . . . . . . . . . . . . . . . . . . . . . . . . . . . . . . . . . . . . (10) (150) (108)
SHO separation . . . . . . . . . . . . . . . . . . . . . . . . . . . . . . . . . . . . . . . . . . . . — — (90)
Adjusted EBITDA as defined(1). . . . . . . . . . . . . . . . . . . . . . . . . . . . . . . . $ (431) $ (361) $ 158
Number of:
Full-line stores. . . . . . . . . . . . . . . . . . . . . . . . . . . . . . . . . . . . . . 717 778 798
Specialty stores . . . . . . . . . . . . . . . . . . . . . . . . . . . . . . . . . . . . . 29 50 54
Total Domestic Sears Stores . . . . . . . . . . . . . . . . . . . . . . . . . . . 746 828 852
__________________
(1) Adjusted to reflect the results of the Lands' End and Sears Hometown and Outlet businesses that were
included in our results of operations prior to the separation.