Sears 2014 Annual Report Download - page 41
Download and view the complete annual report
Please find page 41 of the 2014 Sears annual report below. You can navigate through the pages in the report by either clicking on the pages listed below, or by using the keyword search tool below to find specific information within the annual report.-
 1
1 -
2
-
3
-
4
-
5
-
6
-
7
-
8
-
9
-
10
-
11
-
12
-
13
-
14
-
15
-
16
-
17
-
18
-
19
-
20
-
21
-
22
-
23
-
24
-
25
-
26
-
27
-
28
-
29
-
30
-
 31
31 -
 32
32 -
 33
33 -
 34
34 -
 35
35 -
 36
36 -
 37
37 -
 38
38 -
 39
39 -
 40
40 -
 41
41 -
 42
42 -
 43
43 -
 44
44 -
 45
45 -
 46
46 -
 47
47 -
 48
48 -
 49
49 -
 50
50 -
 51
51 -
52
-
53
-
54
-
55
-
56
-
57
-
58
-
59
-
60
-
61
-
62
-
63
-
64
-
65
-
66
-
67
-
68
-
69
-
70
-
71
-
72
-
73
-
74
-
75
-
76
-
77
-
78
-
79
-
80
-
81
-
82
-
83
-
84
-
85
-
86
-
87
-
88
-
89
-
90
-
91
-
92
-
93
-
94
-
95
-
96
-
97
-
98
-
99
-
100
-
101
-
102
-
103
-
104
-
105
-
106
-
107
-
108
-
109
-
110
-
111
-
112
-
113
-
114
-
115
-
116
-
117
-
118
-
119
-
120
-
121
-
122
-
123
-
124
-
125
-
126
-
127
-
128
-
129
-
130
-
131
-
132
-
133
-
134
-
135
-
136
-
137
-
138
-
139
-
140
-
141
-
142
-
143
 |
 |
41
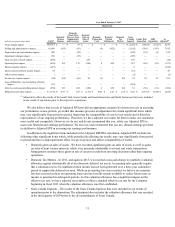
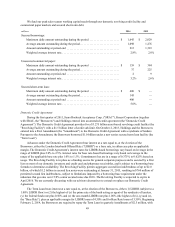
segment for which we received $16 million of cash proceeds. The gain on sales of assets in 2013 included a gain of
$43 million related to the sale of a store previously operated under The Great Indoors format and two Sears Full-line
stores for which the Company received $74 million in proceeds.
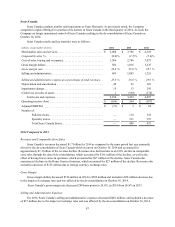
Operating Loss
Sears Domestic reported an operating loss of $920 million in 2014 compared to $940 million in 2013. Sears
Domestic’s operating loss in 2014 included expenses related to domestic pension plans, store closings, store
impairments, severance, expenses associated with legal matters and transactions costs, as well as operating income
from the Lands' End business and gains on the sales of assets which aggregated to an operating expense of $87
million. Operating loss in 2013 included expenses related to domestic pension plans, store closings, store
impairments and severance, as well as operating income from the Lands' End business and gains on the sales of
assets, which aggregated to an operating expense of $112 million. Excluding these items, Sears Domestic would
have reported an operating loss of $833 million and $828 million in 2014 and 2013, respectively. The slight increase
in operating loss in 2014 was driven by the above noted decline in sales and gross margin, partially offset by a
decreases in selling and administrative and depreciation expenses.
2013 Compared to 2012
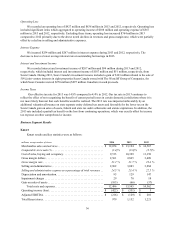
Revenues and Comparable Store Sales
Sears Domestic’s revenues decreased by $1.8 billion to $19.2 billion in 2013. The decline in revenue was due
to lower comparable store sales, which accounted for approximately $515 million of the decline, and the effect of
having fewer stores in operation, which accounted for approximately $470 million of the decline. Revenues for the
year were also impacted by approximately $490 million attributable to the separation of SHO, which occurred in the
third quarter of 2012. The prior year first nine months, which included the separation of SHO, included revenues of
approximately $1.7 billion related to SHO merchandise sales to its customers, as well as $70 million for
merchandise sold to SHO for resale which occurred after the separation. The first nine months of 2013, included
revenues from SHO of approximately $1.3 billion, primarily related to merchandise sold to SHO for resale. Fiscal
2012 also benefited from $275 million of revenue attributable to the 53rd week.
Sears Domestic comparable store sales declined 4.1%, which reflects decreases in most categories including
the home appliance, consumer electronics, tools and lawn & garden categories, as well as declines at Sears Auto
Centers, partially offset by increases in the home and footwear categories.
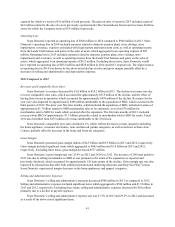
Gross Margin
Sears Domestic generated gross margin dollars of $4.9 billion and $5.9 billion in 2013 and 2012, respectively.
Gross margin included significant items which aggregated to $605 million and $1.0 billion in 2013 and 2012,
respectively. Excluding these items, gross margin decreased $577 million.
Sears Domestic’s gross margin rate was 25.4% in 2013 and 28.0% in 2012. The decrease of 260 basis points in
2013 was due to selling merchandise to SHO at cost pursuant to the terms of the separation as expected and
previously disclosed, which accounted for approximately 120 basis points of the decline. Gross margin rate was also
impacted by transactions that offer both traditional promotional marketing discounts and Shop Your Way® points.
Sears Domestic experienced margin decreases in the home appliances and apparel categories.
Selling and Administrative Expenses
Sears Domestic’s selling and administrative expenses decreased $968 million in 2013 as compared to 2012.
Selling and administrative expenses included significant items which aggregated to $586 million and $1.5 billion in
2013 and 2012, respectively. Excluding these items, selling and administrative expenses decreased by $56 million
primarily due to a decline in payroll expenses.
Sears Domestic’s selling and administrative expense rate was 27.2% in 2013 and 29.5% in 2012 and decreased
as a result of the above noted significant items.