Sears 2014 Annual Report Download - page 19
Download and view the complete annual report
Please find page 19 of the 2014 Sears annual report below. You can navigate through the pages in the report by either clicking on the pages listed below, or by using the keyword search tool below to find specific information within the annual report.-
 1
1 -
2
-
3
-
4
-
5
-
6
-
7
-
8
-
 9
9 -
 10
10 -
 11
11 -
 12
12 -
 13
13 -
 14
14 -
 15
15 -
 16
16 -
 17
17 -
 18
18 -
 19
19 -
 20
20 -
 21
21 -
 22
22 -
 23
23 -
 24
24 -
 25
25 -
 26
26 -
 27
27 -
 28
28 -
 29
29 -
30
-
31
-
32
-
33
-
34
-
35
-
36
-
37
-
38
-
39
-
40
-
41
-
42
-
43
-
44
-
45
-
46
-
47
-
48
-
49
-
50
-
51
-
52
-
53
-
54
-
55
-
56
-
57
-
58
-
59
-
60
-
61
-
62
-
63
-
64
-
65
-
66
-
67
-
68
-
69
-
70
-
71
-
72
-
73
-
74
-
75
-
76
-
77
-
78
-
79
-
80
-
81
-
82
-
83
-
84
-
85
-
86
-
87
-
88
-
89
-
90
-
91
-
92
-
93
-
94
-
95
-
96
-
97
-
98
-
99
-
100
-
101
-
102
-
103
-
104
-
105
-
106
-
107
-
108
-
109
-
110
-
111
-
112
-
113
-
114
-
115
-
116
-
117
-
118
-
119
-
120
-
121
-
122
-
123
-
124
-
125
-
126
-
127
-
128
-
129
-
130
-
131
-
132
-
133
-
134
-
135
-
136
-
137
-
138
-
139
-
140
-
141
-
142
-
143
 |
 |
19
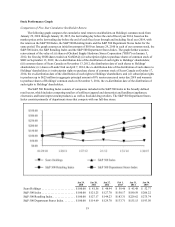
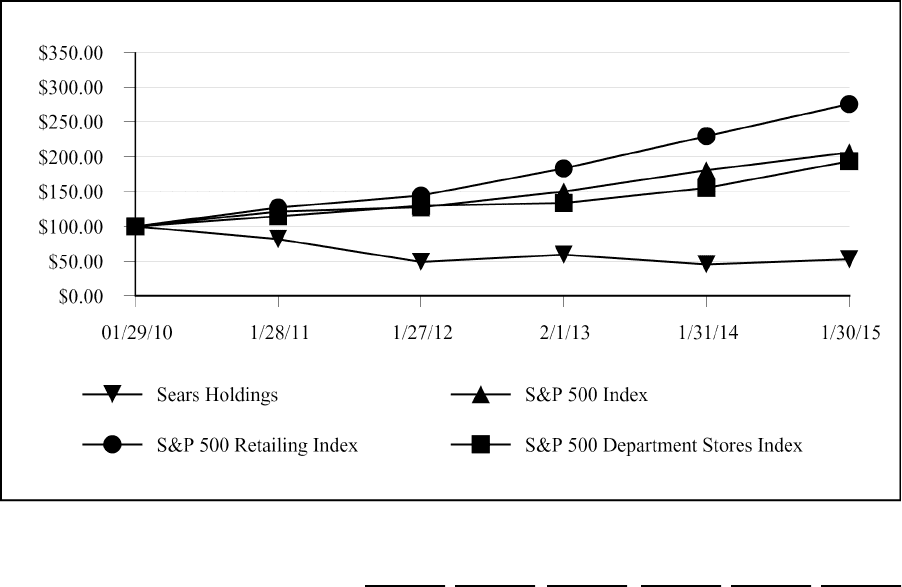
Stock Performance Graph
Comparison of Five-Year Cumulative Stockholder Return
The following graph compares the cumulative total return to stockholders on Holdings' common stock from
January 29, 2010 through January 30, 2015, the last trading day before the end of fiscal year 2014, based on the
market prices at the last trading day before the end of each fiscal year through and including fiscal year 2014, with
the return on the S&P 500 Index, the S&P 500 Retailing Index and the S&P 500 Department Stores Index for the
same period. The graph assumes an initial investment of $100 on January 29, 2010 in each of our common stock, the
S&P 500 Index, the S&P Retailing Index and the S&P 500 Department Stores Index. The graph further assumes
reinvestment of the value of: (i) shares of Orchard Supply Hardware Stores Corporation ("OSH") on January 3,
2012, the first day OSH shares traded on NASDAQ; (ii) subscription rights to purchase shares of common stock of
SHO on September 13, 2012, the ex-distribution date of the distribution of such rights to Holdings’ shareholders;
(iii) common shares of Sears Canada on November 13, 2012, the distribution date of such shares to Holdings’
shareholders; (iv) shares of Lands' End on April 7, 2014, the ex-distribution date of the distribution of such shares to
Holdings' shareholders; (v) subscription rights to purchase shares of common stock of Sears Canada on October 17,
2014, the ex-distribution date of the distribution of such rights to Holdings' shareholders; and (vi) subscription rights
to purchase up to $625 million in aggregate principal amount of 8% senior unsecured notes due 2019 and warrants
to purchase shares of Holdings' common stock on November 3, 2014, the ex-distribution date of the distribution of
such rights to Holdings' shareholders.
The S&P 500 Retailing Index consists of companies included in the S&P 500 Index in the broadly defined
retail sector, which includes competing retailers of softlines (apparel and domestics) and hardlines (appliances,
electronics and home improvement products), as well as food and drug retailers. The S&P 500 Department Stores
Index consists primarily of department stores that compete with our full-line stores.
Jan 29,
2010 Jan 28,
2011 Jan 27,
2012 Feb 1,
2013 Jan 31,
2014 Jan 30,
2015
Sears Holdings . . . . . . . . . . . . . . . . . . . . . . . $100.00 $ 81.56 $ 48.94 $ 59.46 $ 45.48 $ 52.77
S&P 500 Index . . . . . . . . . . . . . . . . . . . . . . . $100.00 $121.25 $127.70 $150.17 $180.59 $206.22
S&P 500 Retailing Index. . . . . . . . . . . . . . . . $100.00 $127.17 $144.23 $183.31 $229.62 $275.74
S&P 500 Department Stores Index. . . . . . . . $100.00 $114.69 $129.70 $133.71 $155.15 $193.50