Sears 2014 Annual Report Download - page 120
Download and view the complete annual report
Please find page 120 of the 2014 Sears annual report below. You can navigate through the pages in the report by either clicking on the pages listed below, or by using the keyword search tool below to find specific information within the annual report.-
 1
1 -
2
-
3
-
4
-
5
-
6
-
7
-
8
-
9
-
10
-
11
-
12
-
13
-
14
-
15
-
16
-
17
-
18
-
19
-
20
-
21
-
22
-
23
-
24
-
25
-
26
-
27
-
28
-
29
-
30
-
31
-
32
-
33
-
34
-
35
-
36
-
37
-
38
-
39
-
40
-
41
-
42
-
43
-
44
-
45
-
46
-
47
-
48
-
49
-
50
-
51
-
52
-
53
-
54
-
55
-
56
-
57
-
58
-
59
-
60
-
61
-
62
-
63
-
64
-
65
-
66
-
67
-
68
-
69
-
70
-
71
-
72
-
73
-
74
-
75
-
76
-
77
-
78
-
79
-
80
-
81
-
82
-
83
-
84
-
85
-
86
-
87
-
88
-
89
-
90
-
91
-
92
-
93
-
94
-
95
-
96
-
97
-
98
-
99
-
100
-
101
-
102
-
103
-
104
-
105
-
106
-
107
-
108
-
109
-
 110
110 -
 111
111 -
 112
112 -
 113
113 -
 114
114 -
 115
115 -
 116
116 -
 117
117 -
 118
118 -
 119
119 -
 120
120 -
 121
121 -
 122
122 -
 123
123 -
 124
124 -
 125
125 -
 126
126 -
 127
127 -
 128
128 -
 129
129 -
 130
130 -
131
-
132
-
133
-
134
-
135
-
136
-
137
-
138
-
139
-
140
-
141
-
142
-
143
 |
 |

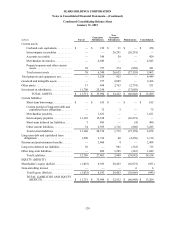
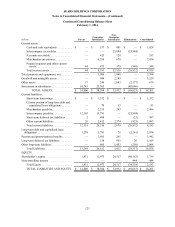
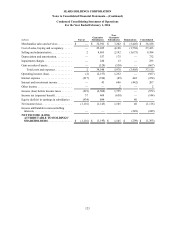
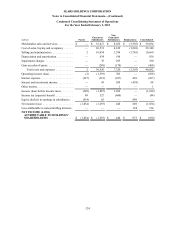
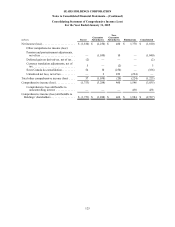
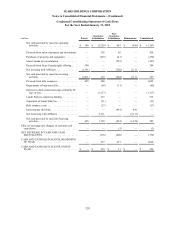
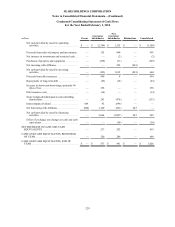
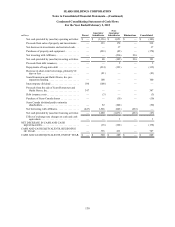
SEARS HOLDINGS CORPORATION
Notes to Consolidated Financial Statements—(Continued)
120
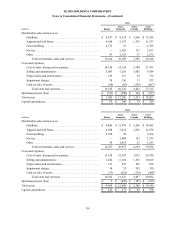
Condensed Consolidating Balance Sheet
January 31, 2015
millions Parent Guarantor
Subsidiaries
Non-
Guarantor
Subsidiaries Eliminations Consolidated
Current assets
Cash and cash equivalents . . . . . . . . . . $ — $ 219 $ 31 $ — $ 250
Intercompany receivables. . . . . . . . . . . — — 26,291 (26,291) —
Accounts receivable . . . . . . . . . . . . . . . — 390 39 — 429
Merchandise inventories. . . . . . . . . . . . — 4,943 — — 4,943
Prepaid expenses and other current
assets . . . . . . . . . . . . . . . . . . . . . . . . . 38 797 274 (868) 241
Total current assets . . . . . . . . . . . . . . . . 38 6,349 26,635 (27,159) 5,863
Total property and equipment, net. . . . . . . . — 3,524 925 — 4,449
Goodwill and intangible assets . . . . . . . . . . — 277 2,089 — 2,366
Other assets . . . . . . . . . . . . . . . . . . . . . . . . . 13 494 2,763 (2,739) 531
Investment in subsidiaries . . . . . . . . . . . . . . 11,700 25,350 — (37,050) —
TOTAL ASSETS. . . . . . . . . . . . . . $ 11,751 $ 35,994 $ 32,412 $ (66,948) $ 13,209
Current liabilities
Short-term borrowings . . . . . . . . . . . . . $ — $ 615 $ — $ — $ 615
Current portion of long-term debt and
capitalized lease obligations . . . . . . . — 72 3 — 75
Merchandise payables. . . . . . . . . . . . . . — 1,621 — — 1,621
Intercompany payables. . . . . . . . . . . . . 11,103 15,188 — (26,291) —
Short-term deferred tax liabilities. . . . . 3 485 — (8) 480
Other current liabilities. . . . . . . . . . . . . 34 2,395 1,716 (860) 3,285
Total current liabilities . . . . . . . . . . . . . 11,140 20,376 1,719 (27,159) 6,076
Long-term debt and capitalized lease
obligations . . . . . . . . . . . . . . . . . . . . . . . . 1,590 3,736 40 (2,256) 3,110
Pension and postretirement benefits . . . . . . — 2,400 4 — 2,404
Long-term deferred tax liabilities . . . . . . . . 56 — 981 (322) 715
Other long-term liabilities . . . . . . . . . . . . . . — 889 1,205 (245) 1,849
Total Liabilities. . . . . . . . . . . . . . . . . . . 12,786 27,401 3,949 (29,982) 14,154
EQUITY (DEFICIT)
Shareholder’s equity (deficit) . . . . . . . . . . . (1,035) 8,593 28,463 (36,972)(951)
Noncontrolling interest . . . . . . . . . . . . . . . . — — — 6 6
Total Equity (Deficit) . . . . . . . . . . . . . . (1,035) 8,593 28,463 (36,966)(945)
TOTAL LIABILITIES AND EQUITY
(DEFICIT). . . . . . . . . . . . . . . . . . . . . $ 11,751 $ 35,994 $ 32,412 $ (66,948) $ 13,209