Sears 2014 Annual Report Download - page 34
Download and view the complete annual report
Please find page 34 of the 2014 Sears annual report below. You can navigate through the pages in the report by either clicking on the pages listed below, or by using the keyword search tool below to find specific information within the annual report.-
 1
1 -
2
-
3
-
4
-
5
-
6
-
7
-
8
-
9
-
10
-
11
-
12
-
13
-
14
-
15
-
16
-
17
-
18
-
19
-
20
-
21
-
22
-
23
-
 24
24 -
 25
25 -
 26
26 -
 27
27 -
 28
28 -
 29
29 -
 30
30 -
 31
31 -
 32
32 -
 33
33 -
 34
34 -
 35
35 -
 36
36 -
 37
37 -
 38
38 -
 39
39 -
 40
40 -
 41
41 -
 42
42 -
 43
43 -
 44
44 -
45
-
46
-
47
-
48
-
49
-
50
-
51
-
52
-
53
-
54
-
55
-
56
-
57
-
58
-
59
-
60
-
61
-
62
-
63
-
64
-
65
-
66
-
67
-
68
-
69
-
70
-
71
-
72
-
73
-
74
-
75
-
76
-
77
-
78
-
79
-
80
-
81
-
82
-
83
-
84
-
85
-
86
-
87
-
88
-
89
-
90
-
91
-
92
-
93
-
94
-
95
-
96
-
97
-
98
-
99
-
100
-
101
-
102
-
103
-
104
-
105
-
106
-
107
-
108
-
109
-
110
-
111
-
112
-
113
-
114
-
115
-
116
-
117
-
118
-
119
-
120
-
121
-
122
-
123
-
124
-
125
-
126
-
127
-
128
-
129
-
130
-
131
-
132
-
133
-
134
-
135
-
136
-
137
-
138
-
139
-
140
-
141
-
142
-
143
 |
 |
34
Income Taxes
Our effective tax rate for 2014 was 7.4% compared to 14.8% in 2013. The application of the requirements for
accounting for income taxes, after consideration of our valuation allowance, causes a significant variation in the
typical relationship between income tax expense and pretax income/loss. Our tax rate in 2014 continues to reflect
the effect of not recognizing the benefit of current period losses in certain domestic and foreign jurisdictions where it
is not more likely than not that such benefits would be realized. The 2014 rate was negatively impacted by a
valuation allowance established on Sears Canada’s deferred tax assets in the third quarter, prior to de-consolidation,
and increased foreign taxes in Puerto Rico resulting from a new tax law change, which became effective during the
second quarter of 2014. These items were partially offset by state audit settlements and statute expirations. In
addition, the 2014 rate was favorably impacted by the book to tax difference for the original issue discount relating
to the $625 million 8% senior unsecured notes issued in November 2014, which resulted in the creation of a deferred
tax liability through additional paid-in capital and a valuation allowance reversal through continuing operations.
2013 Compared to 2012
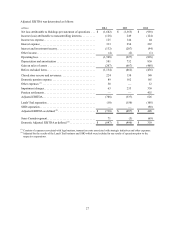
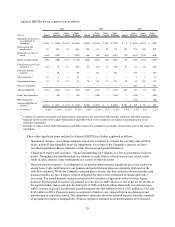
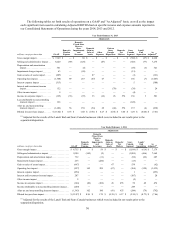
Net Loss Attributable to Holdings' Shareholders
We recorded a net loss attributable to Holdings' shareholders of $1.4 billion ($12.87 loss per diluted share) and
$930 million ($8.78 loss per diluted share) for 2013 and 2012, respectively. Our results for 2013 and 2012 were
affected by a number of significant items. Our net loss as adjusted for these significant items was $792 million
($7.46 loss per diluted share) for 2013 and $306 million ($2.88 loss per diluted share) for 2012. The increase in net
loss for the year reflected a decline in gross margin, which resulted from both a decline in revenues as well as a
decline in gross margin rate of 220 basis points, partially offset by a decrease in selling and administrative expenses.
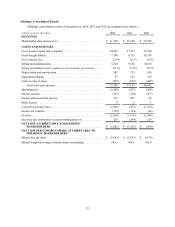
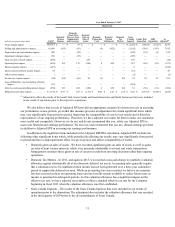
Revenues and Comparable Store Sales
Revenues decreased $3.7 billion, or 9.2%, to $36.2 billion in 2013, as compared to revenues of $39.9 billion in
2012. The revenue decrease was primarily due to the effect of having fewer Kmart and Sears Full-line stores in
operation, which accounted for approximately $1.1 billion of the decline, as well as lower domestic comparable
store sales, which accounted for approximately $1.0 billion of the decline. Revenues for the year were also impacted
by approximately $490 million attributable to the separation of SHO, which occurred in the third quarter of 2012.
The prior year's first nine months, which included the separation of SHO, included revenues of approximately $1.7
billion related to SHO merchandise sales to its customers, as well as $70 million for merchandise sold to SHO for
resale which occurred after the separation. The first nine months of 2013, included revenues from SHO of
approximately $1.3 billion, primarily related to merchandise sold to SHO for resale. Fiscal 2012 also benefited from
approximately $500 million of revenue attributable to the 53rd week. Sears Canada had a 2.7% decline in
comparable store sales during 2013, which accounted for approximately $85 million of the decline. In addition,
Sears Canada revenues experienced declines in 2013 of approximately $150 million as a result of a new licensing
arrangement related to the Sears Home Improvements Product Services ("SHIPS"), and approximately $70 million
due to the closure of four Full-line stores in Sears Canada that occurred in 2012. Finally, Sears Canada revenues in
2013 included a decrease of $157 million due to foreign currency exchange rates.
Domestic comparable store sales declined 3.8%, comprised of decreases of 3.6% at Kmart and 4.1% at Sears
Domestic. The decline at Kmart reflects declines in a majority of categories, most notably grocery & household,
consumer electronics, drugstore and toys. The decline at Sears Domestic reflects decreases in most categories
including the home appliances, consumer electronics, tools and lawn & garden categories, as well as declines at
Sears Auto Centers, partially offset by increases in the home and footwear categories.
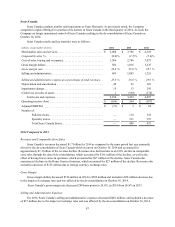
Gross Margin
Gross margin declined $1.8 billion to $8.8 billion in 2013 from $10.5 billion in 2012 due to the above noted
decline in revenues, as well as a decline in gross margin rate. Gross margin included significant items, as noted in
our Adjusted Earnings Per Share tables, which aggregated to $1.6 billion and $2.2 billion in 2013 and 2012,
respectively. Excluding these items, gross margin decreased $1.1 billion.