Sears 2014 Annual Report Download - page 36
Download and view the complete annual report
Please find page 36 of the 2014 Sears annual report below. You can navigate through the pages in the report by either clicking on the pages listed below, or by using the keyword search tool below to find specific information within the annual report.-
 1
1 -
2
-
3
-
4
-
5
-
6
-
7
-
8
-
9
-
10
-
11
-
12
-
13
-
14
-
15
-
16
-
17
-
18
-
19
-
20
-
21
-
22
-
23
-
24
-
25
-
 26
26 -
 27
27 -
 28
28 -
 29
29 -
 30
30 -
 31
31 -
 32
32 -
 33
33 -
 34
34 -
 35
35 -
 36
36 -
 37
37 -
 38
38 -
 39
39 -
 40
40 -
 41
41 -
 42
42 -
 43
43 -
 44
44 -
 45
45 -
 46
46 -
47
-
48
-
49
-
50
-
51
-
52
-
53
-
54
-
55
-
56
-
57
-
58
-
59
-
60
-
61
-
62
-
63
-
64
-
65
-
66
-
67
-
68
-
69
-
70
-
71
-
72
-
73
-
74
-
75
-
76
-
77
-
78
-
79
-
80
-
81
-
82
-
83
-
84
-
85
-
86
-
87
-
88
-
89
-
90
-
91
-
92
-
93
-
94
-
95
-
96
-
97
-
98
-
99
-
100
-
101
-
102
-
103
-
104
-
105
-
106
-
107
-
108
-
109
-
110
-
111
-
112
-
113
-
114
-
115
-
116
-
117
-
118
-
119
-
120
-
121
-
122
-
123
-
124
-
125
-
126
-
127
-
128
-
129
-
130
-
131
-
132
-
133
-
134
-
135
-
136
-
137
-
138
-
139
-
140
-
141
-
142
-
143
 |
 |

36
Operating Loss
We recorded an operating loss of $927 million and $838 million in 2013 and 2012, respectively. Operating loss
included significant items which aggregated to operating income of $108 million and operating expense of $567
million in 2013 and 2012, respectively. Excluding these items, operating loss increased $764 million in 2013
compared to 2012 primarily due to the above noted declines in revenues and gross margin rate, which were partially
offset by a decline in selling and administrative expenses.
Interest Expense
We incurred $254 million and $267 million in interest expense during 2013 and 2012, respectively. The
decrease is due to a lower average interest rate on outstanding borrowings in 2013.
Interest and Investment Income
We recorded interest and investment income of $207 million and $94 million during 2013 and 2012,
respectively, which included interest and investment income of $187 million and $51 million, respectively, from
Sears Canada. During 2013, Sears Canada's investment income included a gain of $163 million related to the sale of
50% joint venture interests in eight properties Sears Canada owned with The Westcliff Group of Companies, for
which Sears Canada received $270 million ($297 million Canadian) in cash proceeds.
Income Taxes
Our effective tax rate for 2013 was 14.8% compared to 4.4% in 2012. Our tax rate in 2013 continues to
reflect the effect of not recognizing the benefit of current period losses in certain domestic jurisdictions where it is
not more likely than not that such benefits would be realized. The 2013 rate was impacted unfavorably by an
additional valuation allowance on state separate entity deferred tax assets and favorably for the lower tax on the
Sears Canada gain on sales of assets, federal and state tax audit settlements and statute expirations. In addition, the
2013 rate included a partial tax benefit on the loss from continuing operations, which was exactly offset by income
tax expense on other comprehensive income.
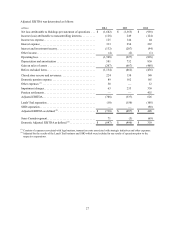
Business Segment Results
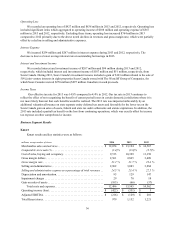
Kmart
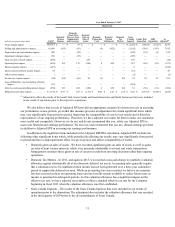
Kmart results and key statistics were as follows:
millions, except number of stores 2014 2013 2012
Merchandise sales and services . . . . . . . . . . . . . . . . . . . . . . . . . . . . . . . . $ 12,074 $ 13,194 $ 14,567
Comparable store sales % . . . . . . . . . . . . . . . . . . . . . . . . . . . . . . . . . . . . (1.4)% (3.6)% (3.7)%
Cost of sales, buying and occupancy. . . . . . . . . . . . . . . . . . . . . . . . . . . . 9,513 10,329 11,158
Gross margin dollars . . . . . . . . . . . . . . . . . . . . . . . . . . . . . . . . . . . . . . . . 2,561 2,865 3,409
Gross margin rate . . . . . . . . . . . . . . . . . . . . . . . . . . . . . . . . . . . . . . . . . . 21.2 % 21.7 % 23.4 %
Selling and administrative . . . . . . . . . . . . . . . . . . . . . . . . . . . . . . . . . . . . 2,962 3,083 3,284
Selling and administrative expense as a percentage of total revenues . . 24.5 % 23.4 % 22.5 %
Depreciation and amortization. . . . . . . . . . . . . . . . . . . . . . . . . . . . . . . . . 95 129 147
Impairment charges . . . . . . . . . . . . . . . . . . . . . . . . . . . . . . . . . . . . . . . . . 29 70 10
Gain on sales of assets . . . . . . . . . . . . . . . . . . . . . . . . . . . . . . . . . . . . . . . (103) (66) (37)
Total costs and expenses. . . . . . . . . . . . . . . . . . . . . . . . . . . . . . . . . . 12,496 13,545 14,562
Operating income (loss). . . . . . . . . . . . . . . . . . . . . . . . . . . . . . . . . . . . . . $ (422) $ (351) $ 5
Adjusted EBITDA . . . . . . . . . . . . . . . . . . . . . . . . . . . . . . . . . . . . . . . . . . $ (216) $ (129) $ 201
Total Kmart stores . . . . . . . . . . . . . . . . . . . . . . . . . . . . . . . . . . . . . . . . . . 979 1,152 1,221