Sears 2014 Annual Report Download - page 26
Download and view the complete annual report
Please find page 26 of the 2014 Sears annual report below. You can navigate through the pages in the report by either clicking on the pages listed below, or by using the keyword search tool below to find specific information within the annual report.-
 1
1 -
2
-
3
-
4
-
5
-
6
-
7
-
8
-
9
-
10
-
11
-
12
-
13
-
14
-
15
-
 16
16 -
 17
17 -
 18
18 -
 19
19 -
 20
20 -
 21
21 -
 22
22 -
 23
23 -
 24
24 -
 25
25 -
 26
26 -
 27
27 -
 28
28 -
 29
29 -
 30
30 -
 31
31 -
 32
32 -
 33
33 -
 34
34 -
 35
35 -
 36
36 -
37
-
38
-
39
-
40
-
41
-
42
-
43
-
44
-
45
-
46
-
47
-
48
-
49
-
50
-
51
-
52
-
53
-
54
-
55
-
56
-
57
-
58
-
59
-
60
-
61
-
62
-
63
-
64
-
65
-
66
-
67
-
68
-
69
-
70
-
71
-
72
-
73
-
74
-
75
-
76
-
77
-
78
-
79
-
80
-
81
-
82
-
83
-
84
-
85
-
86
-
87
-
88
-
89
-
90
-
91
-
92
-
93
-
94
-
95
-
96
-
97
-
98
-
99
-
100
-
101
-
102
-
103
-
104
-
105
-
106
-
107
-
108
-
109
-
110
-
111
-
112
-
113
-
114
-
115
-
116
-
117
-
118
-
119
-
120
-
121
-
122
-
123
-
124
-
125
-
126
-
127
-
128
-
129
-
130
-
131
-
132
-
133
-
134
-
135
-
136
-
137
-
138
-
139
-
140
-
141
-
142
-
143
 |
 |
26
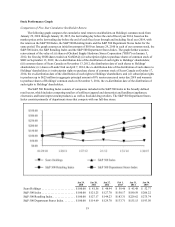
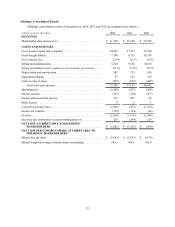
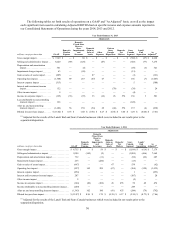
References to comparable store sales amounts within the following discussion include sales for all stores
operating for a period of at least 12 full months, including remodeled and expanded stores, but excluding store
relocations and stores that have undergone format changes. Domestic comparable store sales amounts include sales
from sears.com and kmart.com shipped directly to customers. These online sales resulted in a benefit of
approximately 120 basis points and 60 basis points, respectively, for 2014 and 2013. In addition, domestic
comparable store sales have been adjusted for the change in the unshipped sales reserves recorded at the end of each
reporting period, which resulted in a negative impact of approximately 10 basis points and a positive impact of 10
basis points for 2014 and 2013, respectively.
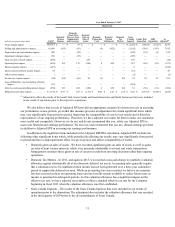
Domestic comparable store sales results for 2014 were calculated based on the 52-week period ended January
31, 2015 as compared to the comparable 52-week period in the prior year. As previously noted, fiscal 2013 was
comprised of the 52-week period ended February 1, 2014, while fiscal 2012 was comprised of the 53-week period
ended February 2, 2013. This one week shift had no impact on the domestic comparable store sales results reported
herein due to the fact that for purposes of reporting domestic comparable store sales results for 2013, weeks one
through 52 for fiscal 2013 have been compared to weeks two through 53 for fiscal year 2012, thereby eliminating
the impact of the one week shift.
2014 Compared to 2013
Net Loss Attributable to Holdings' Shareholders
We recorded a net loss attributable to Holdings' shareholders of $1.7 billion ($15.82 loss per diluted share) and
$1.4 billion ($12.87 loss per diluted share) for 2014 and 2013, respectively. Our results for 2014 and 2013 were
affected by a number of significant items. Our net loss as adjusted for these significant items was $830 million
($7.81 loss per diluted share) for 2014 and $792 million ($7.46 loss per diluted share) for 2013. The increase in net
loss for the year primarily reflected a decline in gross margin, which resulted from both a decline in revenues, as
well as a decline in gross margin rate, partially offset by a decrease in selling and administrative expenses.
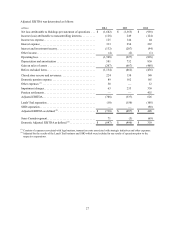
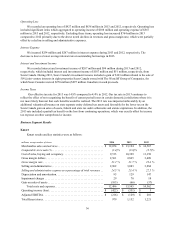
In addition to our net loss from continuing operations determined in accordance with Generally Accepted
Accounting Principles ("GAAP"), for purposes of evaluating operating performance, we use an Adjusted Earnings
Before Interest, Taxes, Depreciation and Amortization ("Adjusted EBITDA") measurement as well as Adjusted
Earnings per Share ("Adjusted EPS").
Adjusted EBITDA is computed as net loss attributable to Sears Holdings Corporation appearing on the
Statements of Operations excluding income (loss) attributable to noncontrolling interests, income tax expense,
interest expense, interest and investment income, other income, depreciation and amortization and gain on sales of
assets. In addition, it is adjusted to exclude certain significant items as set forth below. Our management uses
Adjusted EBITDA to evaluate the operating performance of our businesses, as well as executive compensation
metrics, for comparable periods. Adjusted EBITDA should not be used by investors or other third parties as the sole
basis for formulating investment decisions as it excludes a number of important cash and non-cash recurring items.
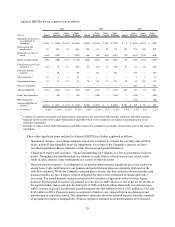
While Adjusted EBITDA and Domestic Adjusted EBITDA are non-GAAP measurements, management
believes that they are important indicators of ongoing operating performance, and useful to investors, because:
• EBITDA excludes the effects of financings and investing activities by eliminating the effects of interest and
depreciation costs;
• Management considers gains/(losses) on the sale of assets to result from investing decisions rather than
ongoing operations; and
• Other significant items, while periodically affecting our results, may vary significantly from period to
period and have a disproportionate effect in a given period, which affects comparability of results.
Adjustments to EBITDA include impairment charges related to fixed assets and intangible assets, pension
settlements, closed store and severance charges, domestic pension expense, expenses associated with legal
matters, transaction costs associated with strategic initiatives and other expenses, the Lands' End
separation, the Sears Canada de-consolidation and the SHO separation. We have adjusted our results for
these items to make our statements more comparable and therefore more useful to investors as the items are
not representative of our ongoing operations and reflect past investment decisions.