Sears 2014 Annual Report Download - page 98
Download and view the complete annual report
Please find page 98 of the 2014 Sears annual report below. You can navigate through the pages in the report by either clicking on the pages listed below, or by using the keyword search tool below to find specific information within the annual report.-
 1
1 -
2
-
3
-
4
-
5
-
6
-
7
-
8
-
9
-
10
-
11
-
12
-
13
-
14
-
15
-
16
-
17
-
18
-
19
-
20
-
21
-
22
-
23
-
24
-
25
-
26
-
27
-
28
-
29
-
30
-
31
-
32
-
33
-
34
-
35
-
36
-
37
-
38
-
39
-
40
-
41
-
42
-
43
-
44
-
45
-
46
-
47
-
48
-
49
-
50
-
51
-
52
-
53
-
54
-
55
-
56
-
57
-
58
-
59
-
60
-
61
-
62
-
63
-
64
-
65
-
66
-
67
-
68
-
69
-
70
-
71
-
72
-
73
-
74
-
75
-
76
-
77
-
78
-
79
-
80
-
81
-
82
-
83
-
84
-
85
-
86
-
87
-
 88
88 -
 89
89 -
 90
90 -
 91
91 -
 92
92 -
 93
93 -
 94
94 -
 95
95 -
 96
96 -
 97
97 -
 98
98 -
 99
99 -
 100
100 -
 101
101 -
 102
102 -
 103
103 -
 104
104 -
 105
105 -
 106
106 -
 107
107 -
 108
108 -
109
-
110
-
111
-
112
-
113
-
114
-
115
-
116
-
117
-
118
-
119
-
120
-
121
-
122
-
123
-
124
-
125
-
126
-
127
-
128
-
129
-
130
-
131
-
132
-
133
-
134
-
135
-
136
-
137
-
138
-
139
-
140
-
141
-
142
-
143
 |
 |

SEARS HOLDINGS CORPORATION
Notes to Consolidated Financial Statements—(Continued)
98
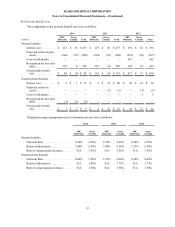
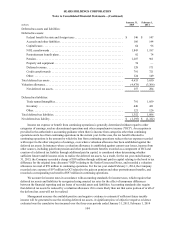
Level 2 as they are primarily valued by institutional bid evaluation, which determines the estimated price a dealer
would pay for a security and which is developed using proprietary models established by the pricing vendors for this
purpose.
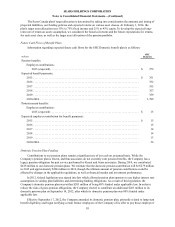
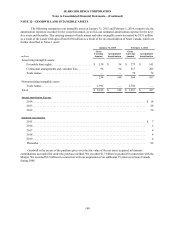
Certain corporate and mortgage-backed and other asset-backed debt securities are assigned to Level 3 based
on the relatively low position in the preferred hierarchy of the pricing source. Valuation of the Plan's non-public
limited partnerships requires significant judgment by the general partners due to the absence of quoted market value,
inherent lack of liquidity, and the long-term nature of the assets, and may result in fair value measurements that are
not indicative of ultimate realizable value. Hedge funds consist of fund-of-funds investments and direct hedge funds
and are assigned to Level 3. The fund-of-funds investments are primarily valued using a market approach based on
the NAVs calculated by the fund and are not publicly available. Direct hedge funds are primarily valued by each
fund's third party administrator based on the valuation of the underlying type of security held and are not publicly
available. All hedge fund investments are in the process of being redeemed.
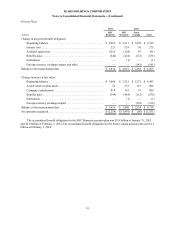
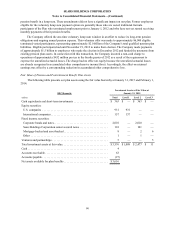
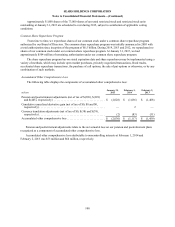
A rollforward of our Level 3 assets each year is as follows:
SHC Domestic
February 1,
2014
Balance
Net Realized and
Unrealized
Losses Purchases Sales and
Settlements
Net Transfers
Into/(Out of)
Level 3
January 31,
2015
Balance
millions
Fixed income securities:
Mortgage-backed and
asset-backed . . . . . . . . . $ — $ — $ 6 $ — $ — $ 6
Ventures and partnerships. . 6 — — (1) — 5
Total Level 3 investments. . $ 6 $ — $ 6 $ (1) $ — $ 11
SHC Domestic
February 2,
2013
Balance
Net Realized and
Unrealized
Gains/(Losses) Purchases Sales and
Settlements
Net Transfers
Into/(Out of)
Level 3
February 1,
2014
Balance
millions
Ventures and partnerships. . $ 12 $ (3) $ — $ (3) $ — $ 6
Total Level 3 investments. . $ 12 $ (3) $ — $ (3) $ — $ 6
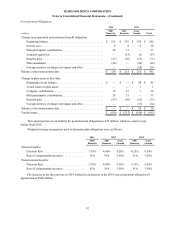
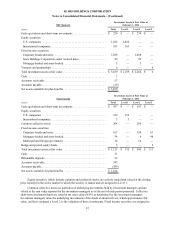
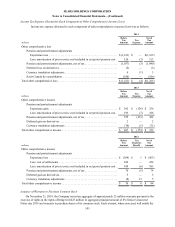
Sears Canada
February 2,
2013
Balance
Net Realized and
Unrealized
Losses Purchases Sales and
Settlements
Net Transfers
Into/(Out of)
Level 3
February 1,
2014
Balance
millions
Fixed income securities:
Corporate bonds and
notes . . . . . . . . . . . . . . . $ 1 $ — $ 63 $ (1) $ — $ 63
Mortgage-backed and
asset-backed . . . . . . . . . 59 (2) — (9) — 48
Hedge and pooled equity
funds . . . . . . . . . . . . . . . . 3 — — (1) — 2
Total Level 3 investments. . $ 63 $ (2) $ 63 $ (11) $ — $ 113
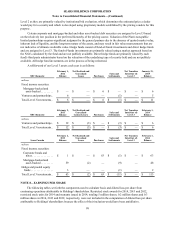
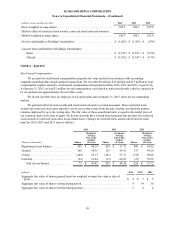
NOTE 8—EARNINGS PER SHARE
The following tables set forth the components used to calculate basic and diluted loss per share from
continuing operations attributable to Holdings' shareholders. Restricted stock awards for 2014, 2013 and 2012,
restricted stock units for 2014 and warrants issued in 2014, totaling 5 million shares, 0.2 million shares and 0.3
million shares in 2014, 2013 and 2012, respectively, were not included in the computation of diluted loss per share
attributable to Holdings' shareholders because the effect of their inclusion would have been antidilutive.