Sears 2014 Annual Report Download - page 28
Download and view the complete annual report
Please find page 28 of the 2014 Sears annual report below. You can navigate through the pages in the report by either clicking on the pages listed below, or by using the keyword search tool below to find specific information within the annual report.-
 1
1 -
2
-
3
-
4
-
5
-
6
-
7
-
8
-
9
-
10
-
11
-
12
-
13
-
14
-
15
-
16
-
17
-
 18
18 -
 19
19 -
 20
20 -
 21
21 -
 22
22 -
 23
23 -
 24
24 -
 25
25 -
 26
26 -
 27
27 -
 28
28 -
 29
29 -
 30
30 -
 31
31 -
 32
32 -
 33
33 -
 34
34 -
 35
35 -
 36
36 -
 37
37 -
 38
38 -
39
-
40
-
41
-
42
-
43
-
44
-
45
-
46
-
47
-
48
-
49
-
50
-
51
-
52
-
53
-
54
-
55
-
56
-
57
-
58
-
59
-
60
-
61
-
62
-
63
-
64
-
65
-
66
-
67
-
68
-
69
-
70
-
71
-
72
-
73
-
74
-
75
-
76
-
77
-
78
-
79
-
80
-
81
-
82
-
83
-
84
-
85
-
86
-
87
-
88
-
89
-
90
-
91
-
92
-
93
-
94
-
95
-
96
-
97
-
98
-
99
-
100
-
101
-
102
-
103
-
104
-
105
-
106
-
107
-
108
-
109
-
110
-
111
-
112
-
113
-
114
-
115
-
116
-
117
-
118
-
119
-
120
-
121
-
122
-
123
-
124
-
125
-
126
-
127
-
128
-
129
-
130
-
131
-
132
-
133
-
134
-
135
-
136
-
137
-
138
-
139
-
140
-
141
-
142
-
143
 |
 |

28
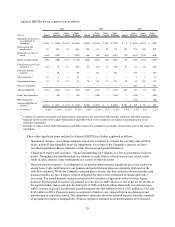
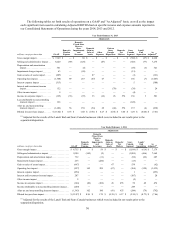
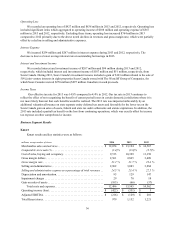
Adjusted EBITDA for our segments was as follows:
2014 2013 2012
millions Kmart Sears
Domestic Sears
Canada Sears
Holdings Kmart Sears
Domestic Sears
Canada Sears
Holdings Kmart Sears
Domestic Sears
Canada Sears
Holdings
Operating income (loss)
per statement of
operations . . . . . . . . . . $(422) $ (920) $ (166) $(1,508) $(351) $ (940) $ 364 $ (927) $ 5 $ (656) $ (187) $ (838)
Depreciation and
amortization. . . . . . . . . 95 437 49 581 129 511 92 732 147 578 105 830
(Gain) loss on sales of
assets . . . . . . . . . . . . . . (103) (105) 1 (207) (66) (63) (538) (667) (37) (261) (170) (468)
Before excluded items . . . (430) (588) (116) (1,134) (288) (492) (82) (862) 115 (339) (252) (476)
Closed store reserve and
severance . . . . . . . . . . . 142 55 27 224 89 (31) 72 130 76 44 20 140
Domestic pension
expense . . . . . . . . . . . . — 89 — 89 — 162 — 162 — 165 — 165
Other expenses (1). . . . . . . 43 4 3 50 — — — — — 9 3 12
Impairment charges . . . . . 29 19 15 63 70 150 13 233 10 25 295 330
Pension settlements . . . . . — — — — — — — — — 452 3 455
Adjusted EBITDA . . . . . . (216) (421) (71) (708) (129) (211) 3 (337) 201 356 69 626
Lands' End separation . . . — (10) — (10) — (150) — (150) — (108) — (108)
SHO Separation . . . . . . . . — — — — — — — — — (90) — (90)
Adjusted EBITDA as
defined (2) . . . . . . . . . . . $(216) $ (431) $ (71) $ (718) $(129) $ (361) $ 3 $ (487) $ 201 $ 158 $ 69 $ 428
% to revenues (3) . . . . . . . . (1.8)% (2.6)% (3.4)% (2.3)% (1.0)% (2.0)% 0.1% (1.4)% 1.4% 0.9% 1.6% 1.2%
(1) Consists of expenses associated with legal matters, transaction costs associated with strategic initiatives and other expenses.
(2) Adjusted for the results of the Lands' End business and SHO which were included in our results of operations prior to the
respective separations.
(3) Excludes revenues of the Lands' End business and SHO which were included in our results of operations prior to the respective
separations.
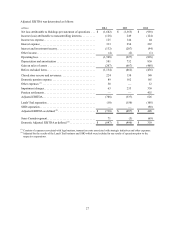
These other significant items included in Adjusted EBITDA are further explained as follows:
• Impairment charges – Accounting standards require the Company to evaluate the carrying value of fixed
assets, goodwill and intangible assets for impairment. As a result of the Company’s analysis, we have
recorded impairment charges related to certain fixed asset and goodwill balances.
• Closed store reserve and severance – We are transforming our Company to a less asset-intensive business
model. Throughout this transformation, we continue to make choices related to our stores, which could
result in sales, closures, lease terminations or a variety of other decisions.
• Domestic pension expense – Contributions to our pension plans remain a significant use of our cash on an
annual basis. Cash contributions to our pension and postretirement plans are separately disclosed on the
cash flow statement. While the Company's pension plan is frozen, and thus associates do not currently earn
pension benefits, we have a legacy pension obligation for past service performed by Kmart and Sears
associates. The annual pension expense included in our statement of operations related to these legacy
domestic pension plans was relatively minimal in years prior to 2009. However, due to the severe decline in
the capital markets that occurred in the latter part of 2008, and the resulting abnormally low interest rates,
which continue to persist, our domestic pension expense was $89 million in 2014, $162 million in 2013 and
$165 million in 2012. Pension expense is comprised of interest cost, expected return on plan assets and
amortization of experience losses. This adjustment eliminates the entire pension expense from the statement
of operations to improve comparability. Pension expense is included in the determination of Net Income.