Sears 2014 Annual Report Download - page 43
Download and view the complete annual report
Please find page 43 of the 2014 Sears annual report below. You can navigate through the pages in the report by either clicking on the pages listed below, or by using the keyword search tool below to find specific information within the annual report.-
 1
1 -
2
-
3
-
4
-
5
-
6
-
7
-
8
-
9
-
10
-
11
-
12
-
13
-
14
-
15
-
16
-
17
-
18
-
19
-
20
-
21
-
22
-
23
-
24
-
25
-
26
-
27
-
28
-
29
-
30
-
31
-
32
-
 33
33 -
 34
34 -
 35
35 -
 36
36 -
 37
37 -
 38
38 -
 39
39 -
 40
40 -
 41
41 -
 42
42 -
 43
43 -
 44
44 -
 45
45 -
 46
46 -
 47
47 -
 48
48 -
 49
49 -
 50
50 -
 51
51 -
 52
52 -
 53
53 -
54
-
55
-
56
-
57
-
58
-
59
-
60
-
61
-
62
-
63
-
64
-
65
-
66
-
67
-
68
-
69
-
70
-
71
-
72
-
73
-
74
-
75
-
76
-
77
-
78
-
79
-
80
-
81
-
82
-
83
-
84
-
85
-
86
-
87
-
88
-
89
-
90
-
91
-
92
-
93
-
94
-
95
-
96
-
97
-
98
-
99
-
100
-
101
-
102
-
103
-
104
-
105
-
106
-
107
-
108
-
109
-
110
-
111
-
112
-
113
-
114
-
115
-
116
-
117
-
118
-
119
-
120
-
121
-
122
-
123
-
124
-
125
-
126
-
127
-
128
-
129
-
130
-
131
-
132
-
133
-
134
-
135
-
136
-
137
-
138
-
139
-
140
-
141
-
142
-
143
 |
 |

43
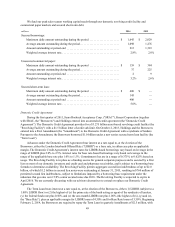
Sears Canada
Sears Canada conducts similar retail operations as Sears Domestic. As previously noted, the Company
completed a rights offering for a portion of its interest in Sears Canada in the third quarter of 2014. As such, the
Company no longer maintained control of Sears Canada resulting in the de-consolidation of Sears Canada on
October 16, 2014.
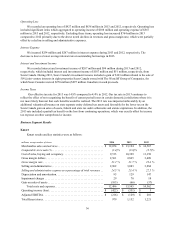
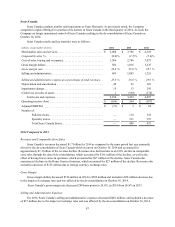
Sears Canada results and key statistics were as follows:
millions, except number of stores 2014 2013 2012
Merchandise sales and services. . . . . . . . . . . . . . . . . . . . . . . . . . . . . . . . $ 2,088 $ 3,796 $ 4,310
Comparable sales % . . . . . . . . . . . . . . . . . . . . . . . . . . . . . . . . . . . . . . . . (8.0)% (2.7)% (5.6)%
Cost of sales, buying and occupancy. . . . . . . . . . . . . . . . . . . . . . . . . . . . 1,586 2,780 3,075
Gross margin dollars . . . . . . . . . . . . . . . . . . . . . . . . . . . . . . . . . . . . . . . . 502 1,016 1,235
Gross margin rate . . . . . . . . . . . . . . . . . . . . . . . . . . . . . . . . . . . . . . . . . . 24.0 % 26.8 % 28.7 %
Selling and administrative. . . . . . . . . . . . . . . . . . . . . . . . . . . . . . . . . . . . 603 1,085 1,251
Selling and administrative expense as a percentage of total revenues . . 28.9 % 28.6 % 29.0 %
Depreciation and amortization . . . . . . . . . . . . . . . . . . . . . . . . . . . . . . . . 49 92 105
Impairment charges . . . . . . . . . . . . . . . . . . . . . . . . . . . . . . . . . . . . . . . . . 15 13 295
(Gain) loss on sales of assets. . . . . . . . . . . . . . . . . . . . . . . . . . . . . . . . . . 1 (538) (170)
Total costs and expenses. . . . . . . . . . . . . . . . . . . . . . . . . . . . . . . . . . 2,254 3,432 4,497
Operating income (loss) . . . . . . . . . . . . . . . . . . . . . . . . . . . . . . . . . . . . . $ (166) $ 364 $ (187)
Adjusted EBITDA. . . . . . . . . . . . . . . . . . . . . . . . . . . . . . . . . . . . . . . . . . $ (71) $ 3 $ 69
Number of:
Full-line stores. . . . . . . . . . . . . . . . . . . . . . . . . . . . . . . . . . . . . . — 118 118
Specialty stores . . . . . . . . . . . . . . . . . . . . . . . . . . . . . . . . . . . . . — 331 357
Total Sears Canada Stores. . . . . . . . . . . . . . . . . . . . . . . . . . . . . — 449 475
2014 Compared to 2013
Revenues and Comparable Store Sales
Sears Canada's revenues decreased $1.7 billion for 2014 as compared to the same period last year primarily
driven by the de-consolidation of Sears Canada which occurred on October 16, 2014 and accounted for
approximately $1.3 billion of the revenue decline. Revenues also declined due to an 8.0% decline in comparable
store sales through the date of de-consolidation, which accounted for $161 million of the decline, as well as the
effect of having fewer stores in operation, which accounted for $97 million of the decline. Sears Canada also
experienced declines in the Home Services business, which accounted for $27 million of the decline. Revenues also
included a decrease of $125 million due to foreign currency exchange rates.
Gross Margin
Gross margin dollars decreased $514 million in 2014 to $502 million and included a $28 million decrease due
to the impact of exchange rates and was affected by the de-consolidation on October 16, 2014.
Sears Canada’s gross margin rate decreased 280 basis points to 24.0%, in 2014 from 26.8% in 2013.
Selling and Administrative Expenses
For 2014, Sears Canada’s selling and administrative expenses decreased $482 million, and included a decrease
of $37 million due to the impact of exchange rates and was affected by the de-consolidation on October 16, 2014.