Sears 2014 Annual Report Download - page 115
Download and view the complete annual report
Please find page 115 of the 2014 Sears annual report below. You can navigate through the pages in the report by either clicking on the pages listed below, or by using the keyword search tool below to find specific information within the annual report.-
 1
1 -
2
-
3
-
4
-
5
-
6
-
7
-
8
-
9
-
10
-
11
-
12
-
13
-
14
-
15
-
16
-
17
-
18
-
19
-
20
-
21
-
22
-
23
-
24
-
25
-
26
-
27
-
28
-
29
-
30
-
31
-
32
-
33
-
34
-
35
-
36
-
37
-
38
-
39
-
40
-
41
-
42
-
43
-
44
-
45
-
46
-
47
-
48
-
49
-
50
-
51
-
52
-
53
-
54
-
55
-
56
-
57
-
58
-
59
-
60
-
61
-
62
-
63
-
64
-
65
-
66
-
67
-
68
-
69
-
70
-
71
-
72
-
73
-
74
-
75
-
76
-
77
-
78
-
79
-
80
-
81
-
82
-
83
-
84
-
85
-
86
-
87
-
88
-
89
-
90
-
91
-
92
-
93
-
94
-
95
-
96
-
97
-
98
-
99
-
100
-
101
-
102
-
103
-
104
-
 105
105 -
 106
106 -
 107
107 -
 108
108 -
 109
109 -
 110
110 -
 111
111 -
 112
112 -
 113
113 -
 114
114 -
 115
115 -
 116
116 -
 117
117 -
 118
118 -
 119
119 -
 120
120 -
 121
121 -
 122
122 -
 123
123 -
 124
124 -
 125
125 -
126
-
127
-
128
-
129
-
130
-
131
-
132
-
133
-
134
-
135
-
136
-
137
-
138
-
139
-
140
-
141
-
142
-
143
 |
 |

SEARS HOLDINGS CORPORATION
Notes to Consolidated Financial Statements—(Continued)
115
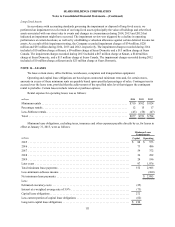
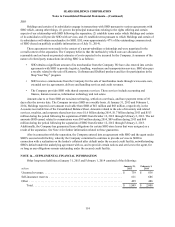
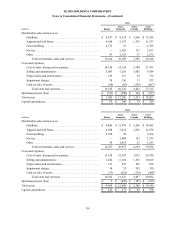
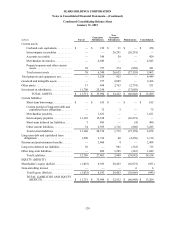
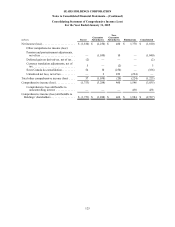
NOTE 17—SUMMARY OF SEGMENT DATA
These reportable segment classifications are based on our business formats, as described in Note 1. The Kmart
and Sears Canada formats each represent both an operating and reportable segment. As a result of the de-
consolidation of Sears Canada as described in Note 2, Sears Canada is no longer an operating or reportable segment,
and the segment results presented below reflect the operating results for Sears Canada through October 16, 2014.
The Sears Domestic reportable segment consists of the aggregation of several business formats. These formats are
evaluated by our Chief Operating Decision Maker ("CODM") to make decisions about resource allocation and to
assess performance.
Each of these segments derives its revenues from the sale of merchandise and related services to customers,
primarily in the United States and Canada. The merchandise and service categories are as follows:
(i) Hardlines—consists of home appliances, consumer electronics, lawn & garden, tools & hardware,
automotive parts, household goods, toys, housewares and sporting goods;
(ii) Apparel and Soft Home—includes women's, men's, kids', footwear, jewelry, accessories and soft home;
(iii) Food and Drug—consists of grocery & household, pharmacy and drugstore;
(iv) Service—includes repair, installation and automotive service and extended contract revenue; and
(v) Other—includes revenues earned in connection with our agreements with SHO and Lands' End, as well as
credit revenues and licensed business revenues.
2014
millions Kmart Sears
Domestic Sears
Canada Sears
Holdings
Merchandise sales and services:
Hardlines. . . . . . . . . . . . . . . . . . . . . . . . . . . . . . . . . . . . . . . . . . . $ 3,605 $ 8,903 $ 1,100 $ 13,608
Apparel and Soft Home . . . . . . . . . . . . . . . . . . . . . . . . . . . . . . . 4,049 3,673 880 8,602
Food and Drug . . . . . . . . . . . . . . . . . . . . . . . . . . . . . . . . . . . . . . 4,326 12 — 4,338
Service . . . . . . . . . . . . . . . . . . . . . . . . . . . . . . . . . . . . . . . . . . . . 17 2,318 77 2,412
Other . . . . . . . . . . . . . . . . . . . . . . . . . . . . . . . . . . . . . . . . . . . . . . 77 2,130 31 2,238
Total merchandise sales and services . . . . . . . . . . . . . . . . . 12,074 17,036 2,088 31,198
Costs and expenses:
Cost of sales, buying and occupancy . . . . . . . . . . . . . . . . . . . . . 9,513 12,950 1,586 24,049
Selling and administrative . . . . . . . . . . . . . . . . . . . . . . . . . . . . . 2,962 4,655 603 8,220
Depreciation and amortization . . . . . . . . . . . . . . . . . . . . . . . . . . 95 437 49 581
Impairment charges . . . . . . . . . . . . . . . . . . . . . . . . . . . . . . . . . . 29 19 15 63
(Gain) loss on sales of assets . . . . . . . . . . . . . . . . . . . . . . . . . . . (103)(105) 1 (207)
Total costs and expenses . . . . . . . . . . . . . . . . . . . . . . . . . . . 12,496 17,956 2,254 32,706
Operating loss . . . . . . . . . . . . . . . . . . . . . . . . . . . . . . . . . . . . . . . . . . $(422) $ (920) $ (166) $ (1,508)
Total assets. . . . . . . . . . . . . . . . . . . . . . . . . . . . . . . . . . . . . . . . . . . . . $ 3,155 $ 10,054 $ — $ 13,209
Capital expenditures. . . . . . . . . . . . . . . . . . . . . . . . . . . . . . . . . . . . . . $ 45 $ 193 $ 32 $ 270