Sears 2014 Annual Report Download - page 122
Download and view the complete annual report
Please find page 122 of the 2014 Sears annual report below. You can navigate through the pages in the report by either clicking on the pages listed below, or by using the keyword search tool below to find specific information within the annual report.-
 1
1 -
2
-
3
-
4
-
5
-
6
-
7
-
8
-
9
-
10
-
11
-
12
-
13
-
14
-
15
-
16
-
17
-
18
-
19
-
20
-
21
-
22
-
23
-
24
-
25
-
26
-
27
-
28
-
29
-
30
-
31
-
32
-
33
-
34
-
35
-
36
-
37
-
38
-
39
-
40
-
41
-
42
-
43
-
44
-
45
-
46
-
47
-
48
-
49
-
50
-
51
-
52
-
53
-
54
-
55
-
56
-
57
-
58
-
59
-
60
-
61
-
62
-
63
-
64
-
65
-
66
-
67
-
68
-
69
-
70
-
71
-
72
-
73
-
74
-
75
-
76
-
77
-
78
-
79
-
80
-
81
-
82
-
83
-
84
-
85
-
86
-
87
-
88
-
89
-
90
-
91
-
92
-
93
-
94
-
95
-
96
-
97
-
98
-
99
-
100
-
101
-
102
-
103
-
104
-
105
-
106
-
107
-
108
-
109
-
110
-
111
-
 112
112 -
 113
113 -
 114
114 -
 115
115 -
 116
116 -
 117
117 -
 118
118 -
 119
119 -
 120
120 -
 121
121 -
 122
122 -
 123
123 -
 124
124 -
 125
125 -
 126
126 -
 127
127 -
 128
128 -
 129
129 -
 130
130 -
 131
131 -
 132
132 -
133
-
134
-
135
-
136
-
137
-
138
-
139
-
140
-
141
-
142
-
143
 |
 |

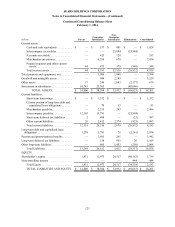
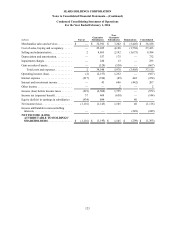
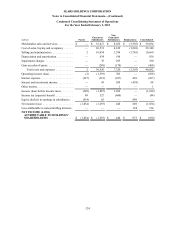
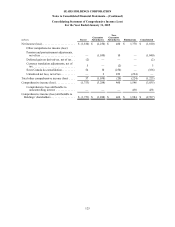
SEARS HOLDINGS CORPORATION
Notes to Consolidated Financial Statements—(Continued)
122
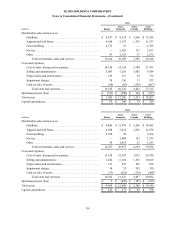
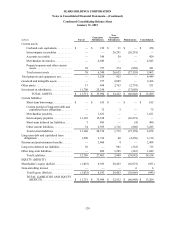
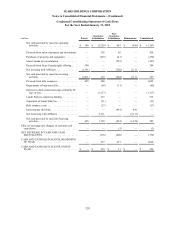
Condensed Consolidating Statement of Operations
For the Year Ended January 31, 2015
millions Parent Guarantor
Subsidiaries
Non-
Guarantor
Subsidiaries Eliminations Consolidated
Merchandise sales and services . . . . . . . . . . $ — $ 29,277 $ 5,187 $ (3,266) $ 31,198
Cost of sales, buying and occupancy. . . . . . — 22,917 2,820 (1,688) 24,049
Selling and administrative . . . . . . . . . . . . . . 2 8,283 1,513 (1,578) 8,220
Depreciation and amortization. . . . . . . . . . . — 454 127 — 581
Impairment charges . . . . . . . . . . . . . . . . . . . — 48 15 — 63
Gain on sales of assets . . . . . . . . . . . . . . . . . —(180)(27) — (207)
Total costs and expenses. . . . . . . . . . . . 2 31,522 4,448 (3,266) 32,706
Operating income (loss). . . . . . . . . . . . . . . . (2) (2,245) 739 — (1,508)
Interest expense . . . . . . . . . . . . . . . . . . . . . . (223) (469)(92) 471 (313)
Interest and investment income . . . . . . . . . . 92 28 483 (471) 132
Other income . . . . . . . . . . . . . . . . . . . . . . . . — — 4 — 4
Income (loss) before income taxes . . . . . . . (133) (2,686) 1,134 — (1,685)
Income tax (expense) benefit. . . . . . . . . . . . 40 489 (654) — (125)
Deficit in earnings in subsidiaries . . . . . . . . (1,717) (53) — 1,770 —
Net income (loss). . . . . . . . . . . . . . . . . . . . . (1,810) (2,250) 480 1,770 (1,810)
Loss attributable to noncontrolling interests — — — 128 128
NET INCOME (LOSS)
ATTRIBUTABLE TO HOLDINGS’
SHAREHOLDERS. . . . . . . . . . . . . . . . . $ (1,810) $ (2,250) $ 480 $ 1,898 $ (1,682)