Sears 2014 Annual Report Download - page 30
Download and view the complete annual report
Please find page 30 of the 2014 Sears annual report below. You can navigate through the pages in the report by either clicking on the pages listed below, or by using the keyword search tool below to find specific information within the annual report.-
 1
1 -
2
-
3
-
4
-
5
-
6
-
7
-
8
-
9
-
10
-
11
-
12
-
13
-
14
-
15
-
16
-
17
-
18
-
19
-
 20
20 -
 21
21 -
 22
22 -
 23
23 -
 24
24 -
 25
25 -
 26
26 -
 27
27 -
 28
28 -
 29
29 -
 30
30 -
 31
31 -
 32
32 -
 33
33 -
 34
34 -
 35
35 -
 36
36 -
 37
37 -
 38
38 -
 39
39 -
 40
40 -
41
-
42
-
43
-
44
-
45
-
46
-
47
-
48
-
49
-
50
-
51
-
52
-
53
-
54
-
55
-
56
-
57
-
58
-
59
-
60
-
61
-
62
-
63
-
64
-
65
-
66
-
67
-
68
-
69
-
70
-
71
-
72
-
73
-
74
-
75
-
76
-
77
-
78
-
79
-
80
-
81
-
82
-
83
-
84
-
85
-
86
-
87
-
88
-
89
-
90
-
91
-
92
-
93
-
94
-
95
-
96
-
97
-
98
-
99
-
100
-
101
-
102
-
103
-
104
-
105
-
106
-
107
-
108
-
109
-
110
-
111
-
112
-
113
-
114
-
115
-
116
-
117
-
118
-
119
-
120
-
121
-
122
-
123
-
124
-
125
-
126
-
127
-
128
-
129
-
130
-
131
-
132
-
133
-
134
-
135
-
136
-
137
-
138
-
139
-
140
-
141
-
142
-
143
 |
 |

30
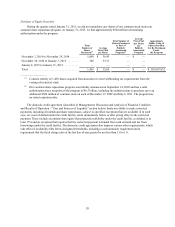
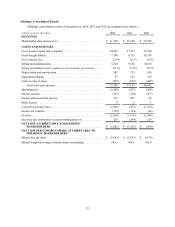
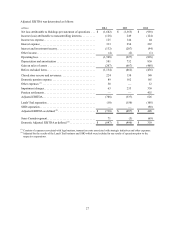
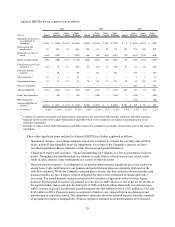
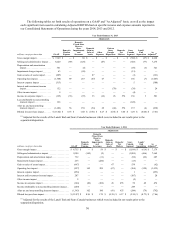
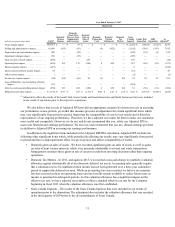
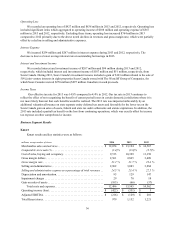
The following tables set forth results of operations on a GAAP and "As Adjusted" basis, as well as the impact
each significant item used in calculating Adjusted EBITDA had on specific income and expense amounts reported in
our Consolidated Statements of Operations during the years 2014, 2013 and 2012.
Year Ended January 31, 2015
Adjustments
millions, except per share data GAAP
Domestic
Pension
Expense
Domestic
Closed Store
Reserve,
Store
Impairments
and
Severance
Domestic
Gain on
Sales of
Assets Other
Expenses
Gain on
Sears
Canada
Disposition
Domestic
Tax
Matters
Sears
Canada
Segment
Lands'
End
Separation As
Adjusted(1)
Gross margin impact. . . . . . . . . . . . . $ 7,149 $ — $ 68 $ — $ — $ — $ — $ (502) $ (87) $ 6,628
Selling and administrative impact . . 8,220 (89) (129) — (47) — — (603) (77) 7,275
Depreciation and amortization
impact. . . . . . . . . . . . . . . . . . . . . . 581 — (8) — — — — (49) (3) 521
Impairment charges impact . . . . . . . 63 — (48) — — — — (15) — —
Gain on sales of assets impact . . . . . (207) — — 87 — — — (1) — (121)
Operating loss impact. . . . . . . . . . . . (1,508) 89 253 (87) 47 — — 166 (7) (1,047)
Interest expense impact . . . . . . . . . . (313) — — — — — — 5 — (308)
Interest and investment income
impact. . . . . . . . . . . . . . . . . . . . . . 132 — — — — (70) — (38) — 24
Other income impact . . . . . . . . . . . . 4 — — — — — — (4) — —
Income tax expense impact . . . . . . . (125) (33) (95) 33 (18) 26 574 136 3 501
Loss attributable to noncontrolling
interests impact . . . . . . . . . . . . . . 128 — — — — — — (128) — —
After tax and noncontrolling
interests impact . . . . . . . . . . . . . . (1,682) 56 158 (54) 29 (44) 574 137 (4) (830)
Diluted loss per share impact . . . . . . $ (15.82) $ 0.53 $ 1.48 $ (0.51) $ 0.27 $ (0.41) $ 5.40 $ 1.29 $ (0.04) $ (7.81)
(1) Adjusted for the results of the Lands' End and Sears Canada businesses which were included in our results prior to the
separation/disposition.
Year Ended February 1, 2014
Adjustments
millions, except per share data GAAP
Domestic
Pension
Expense
Domestic
Closed Store
Reserve,
Store
Impairments
and
Severance
Domestic
Gain on
Sales of
Assets
Domestic
Tax
Matters
Sears
Canada
Segment
Lands'
End
Separation As
Adjusted(1)
Gross margin impact . . . . . . . . . . . . . . . . . . . . . . . . . . . . $ 8,755 $ — $ 56 $ — $ — $ (1,016) $ (616) $ 7,179
Selling and administrative impact . . . . . . . . . . . . . . . . . . 9,384 (162) (2) — — (1,085) (466) 7,669
Depreciation and amortization impact. . . . . . . . . . . . . . . 732 — (11) — — (92) (22) 607
Impairment charges impact . . . . . . . . . . . . . . . . . . . . . . . 233 — (220) — — (13) — —
Gain on sales of assets impact . . . . . . . . . . . . . . . . . . . . . (667) — — 67 — 538 — (62)
Operating loss impact . . . . . . . . . . . . . . . . . . . . . . . . . . . (927) 162 289 (67) — (364) (128) (1,035)
Interest expense impact . . . . . . . . . . . . . . . . . . . . . . . . . . (254) — — — — 1 — (253)
Interest and investment income impact . . . . . . . . . . . . . . 207 — — — — (187) — 20
Other income impact . . . . . . . . . . . . . . . . . . . . . . . . . . . . 2 — — — — (2) — —
Income tax expense impact . . . . . . . . . . . . . . . . . . . . . . . (144) (60) (109) 26 655 59 49 476
Income attributable to noncontrolling interests impact . . (249) — — — — 249 — —
After tax and noncontrolling interests impact . . . . . . . . . (1,365) 102 180 (41) 655 (244) (79) (792)
Diluted loss per share impact. . . . . . . . . . . . . . . . . . . . . . $ (12.87) $ 0.96 $ 1.70 $ (0.39) $ 6.17 $ (2.30) $ (0.73) $ (7.46)
(1) Adjusted for the results of the Lands' End and Sears Canada businesses which were included in our results prior to the
separation/disposition.