Sears 2014 Annual Report Download - page 46
Download and view the complete annual report
Please find page 46 of the 2014 Sears annual report below. You can navigate through the pages in the report by either clicking on the pages listed below, or by using the keyword search tool below to find specific information within the annual report.-
 1
1 -
2
-
3
-
4
-
5
-
6
-
7
-
8
-
9
-
10
-
11
-
12
-
13
-
14
-
15
-
16
-
17
-
18
-
19
-
20
-
21
-
22
-
23
-
24
-
25
-
26
-
27
-
28
-
29
-
30
-
31
-
32
-
33
-
34
-
35
-
 36
36 -
 37
37 -
 38
38 -
 39
39 -
 40
40 -
 41
41 -
 42
42 -
 43
43 -
 44
44 -
 45
45 -
 46
46 -
 47
47 -
 48
48 -
 49
49 -
 50
50 -
 51
51 -
 52
52 -
 53
53 -
 54
54 -
 55
55 -
 56
56 -
57
-
58
-
59
-
60
-
61
-
62
-
63
-
64
-
65
-
66
-
67
-
68
-
69
-
70
-
71
-
72
-
73
-
74
-
75
-
76
-
77
-
78
-
79
-
80
-
81
-
82
-
83
-
84
-
85
-
86
-
87
-
88
-
89
-
90
-
91
-
92
-
93
-
94
-
95
-
96
-
97
-
98
-
99
-
100
-
101
-
102
-
103
-
104
-
105
-
106
-
107
-
108
-
109
-
110
-
111
-
112
-
113
-
114
-
115
-
116
-
117
-
118
-
119
-
120
-
121
-
122
-
123
-
124
-
125
-
126
-
127
-
128
-
129
-
130
-
131
-
132
-
133
-
134
-
135
-
136
-
137
-
138
-
139
-
140
-
141
-
142
-
143
 |
 |
46
significant uses of cash during 2014 included contributions to our pension and postretirement benefit plans of $450
million, capital expenditures of $270 million, interest of $230 million and taxes of $119 million.
At various times, we have posted cash collateral for certain outstanding letters of credit and self-insurance
programs. Such cash collateral is classified within cash and cash equivalents given we have the ability to substitute
letters of credit at any time for this cash collateral and it is therefore readily available to us.
Our invested cash may include, from time to time, investments in, but not limited to, commercial paper,
federal, state and municipal government securities, floating-rate notes, repurchase agreements and money market
funds. Cash amounts held in these short-term investments are readily available to us.
Credit card deposits in transit include deposits in transit from banks for payments related to third-party credit
card and debit card transactions.
Restricted cash consisted of cash related to Sears Canada’s balances, which had been pledged as collateral for
letters of credit obligations issued under its offshore merchandise purchasing program.
We classify outstanding checks in excess of funds on deposit within other current liabilities and reduce cash
balances when these checks clear the bank on which they were drawn. Outstanding checks in excess of funds on
deposit were $85 million and $97 million as of January 31, 2015 and February 1, 2014, respectively.
Investment of Available Capital
Since the Merger, we have continued to invest in our businesses to transform the customer experience as the
retail industry evolves and provide the opportunity for attractive returns. Our Board of Directors has delegated
authority to direct investment of our surplus cash to our Chairman and Chief Executive Officer, Edward S. Lampert,
subject to various limitations that have been or may be from time to time adopted by the Board of Directors and/or
Finance Committee of the Board of Directors.
Operating Activities
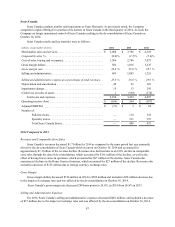
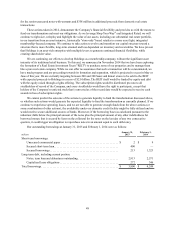
The Company used $1.4 billion of cash in its operations during 2014, $1.1 billion during 2013 and $303
million during 2012. Our primary source of operating cash flows is the sale of goods and services to customers,
while the primary use of cash in operations is the purchase of merchandise inventories. We used more cash in
operations in 2014 compared to the prior year primarily driven by an increase in operating loss, which was partially
offset by less cash being used for merchandise inventory purchases due to inventory productivity initiatives and
store closures. The increase in cash used in operations in 2013 was driven primarily by increased operating losses.
Merchandise inventories were $4.9 billion at January 31, 2015 and $7.0 billion at February 1, 2014.
Merchandise payables were $1.6 billion at January 31, 2015 and $2.5 billion at February 1, 2014. Our Domestic
inventory balances decreased approximately $1.5 billion from $6.4 billion at February 1, 2014 to $4.9 billion at
January 31, 2015. Excluding inventory related to the Lands' End business, our Domestic inventory decreased
approximately $1.1 billion due to both improved productivity and store closures. Sears Domestic inventory
decreased in virtually all categories, with the most notable decreases in the apparel, consumer electronics,
automotive and home categories. Kmart inventory decreased in virtually all categories with the most notable
decreases in the apparel, consumer electronics, drugstore and grocery & household goods categories.
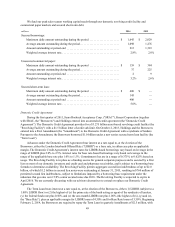
Investing Activities
We generated net cash flows from investing activities of $327 million in 2014, $664 million in 2013 and $191
million in 2012.
For 2014, net cash flows generated from investing activities primarily consisted of cash proceeds from the sale
of properties and investments of $424 million, partially offset by cash used for capital expenditures of $270 million.
Additionally, 2014 included proceeds from the Sears Canada rights offering of $380 million, partially offset by $207
million resulting from the de-consolidation of Sears Canada cash. For 2013, net cash flows generated from investing
activities included cash proceeds from the sales of properties and investments of $995 million, which were partially
offset by cash used for capital expenditures of $329 million. For 2012, net cash flows generated from investing