Sears 2014 Annual Report Download - page 38
Download and view the complete annual report
Please find page 38 of the 2014 Sears annual report below. You can navigate through the pages in the report by either clicking on the pages listed below, or by using the keyword search tool below to find specific information within the annual report.-
 1
1 -
2
-
3
-
4
-
5
-
6
-
7
-
8
-
9
-
10
-
11
-
12
-
13
-
14
-
15
-
16
-
17
-
18
-
19
-
20
-
21
-
22
-
23
-
24
-
25
-
26
-
27
-
 28
28 -
 29
29 -
 30
30 -
 31
31 -
 32
32 -
 33
33 -
 34
34 -
 35
35 -
 36
36 -
 37
37 -
 38
38 -
 39
39 -
 40
40 -
 41
41 -
 42
42 -
 43
43 -
 44
44 -
 45
45 -
 46
46 -
 47
47 -
 48
48 -
49
-
50
-
51
-
52
-
53
-
54
-
55
-
56
-
57
-
58
-
59
-
60
-
61
-
62
-
63
-
64
-
65
-
66
-
67
-
68
-
69
-
70
-
71
-
72
-
73
-
74
-
75
-
76
-
77
-
78
-
79
-
80
-
81
-
82
-
83
-
84
-
85
-
86
-
87
-
88
-
89
-
90
-
91
-
92
-
93
-
94
-
95
-
96
-
97
-
98
-
99
-
100
-
101
-
102
-
103
-
104
-
105
-
106
-
107
-
108
-
109
-
110
-
111
-
112
-
113
-
114
-
115
-
116
-
117
-
118
-
119
-
120
-
121
-
122
-
123
-
124
-
125
-
126
-
127
-
128
-
129
-
130
-
131
-
132
-
133
-
134
-
135
-
136
-
137
-
138
-
139
-
140
-
141
-
142
-
143
 |
 |
38
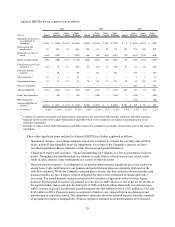
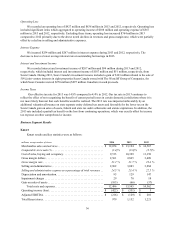
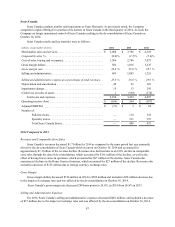
Operating Loss
Kmart recorded an operating loss of $422 million in 2014 as compared to $351 million in 2013. Operating loss
in 2014 included expenses related to store closings, store impairments, severance, expenses associated with legal
matters and other expense, as well as gains on the sales of assets which aggregated to an operating expense of $208
million. Operating income in 2013 also included expenses related to store closings, store impairments and
severance, as well as gains on sales of assets which aggregated to an operating expense of $144 million. Excluding
these items, Kmart would have reported an operating loss of $214 million and $207 million in 2014 and 2013,
respectively. This decline in operating performance was primarily the result of the above noted declines in sales and
gross margin, partially offset by a decreases in selling and administrative and depreciation expenses.
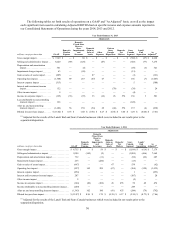
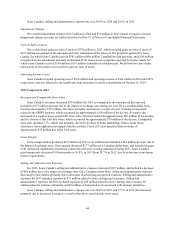
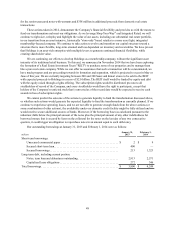
2013 Compared to 2012
Revenues and Comparable Store Sales
Kmart’s revenues decreased by $1.4 billion to $13.2 billion in 2013 due to the effect of having fewer stores in
operation in 2013, which accounted for approximately $625 million of the decline. Revenues were also impacted by
a decrease in comparable store sales of 3.6%, which accounted for approximately $525 million of the decline. In
addition, the prior year benefited from the inclusion of approximately $190 million of revenues recorded in the 53rd
week.
The decline in comparable store sales of 3.6% reflects declines in a majority of categories, most notably
grocery & household, consumer electronics, drugstore and toys.
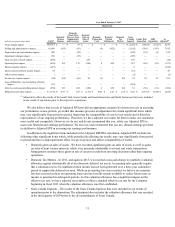
Gross Margin
Kmart generated $2.9 billion in gross margin in 2013 and $3.4 billion in 2012. The decrease in Kmart’s gross
margin is due to the above noted decrease in sales, as well as a decline in gross margin rate. Gross margin included
$45 million and $21 million for markdowns recorded in connection with store closings during 2013 and 2012,
respectively. Excluding these items, gross margin decreased $520 million.
Kmart's gross margin rate declined 170 basis points to 21.7% in 2013 from 23.4% in 2012, and was impacted
by transactions that offer both traditional promotional marketing discounts and Shop Your Way® points. The gross
margin rate reflects decreases experienced in a majority of categories, particularly apparel and grocery & household.
Selling and Administrative Expenses
Kmart’s selling and administrative expenses decreased $201 million in 2013. The decrease primarily reflects
decreases in payroll expense. Selling and administrative expenses for 2013 and 2012 were impacted by expenses of
$44 million and $55 million, respectively, related to store closings and severance.
Kmart’s selling and administrative expense rate was 23.4% in 2013 and 22.5% in 2012 and increased primarily
as a result of lower expense leverage due to the sales decline noted above.
Depreciation and Amortization
Depreciation and amortization expense decreased $18 million in 2013 to $129 million and included charges of
$9 million in both 2013 and 2012, respectively, taken in connection with store closings. The decrease is primarily
due to having fewer assets to depreciate.
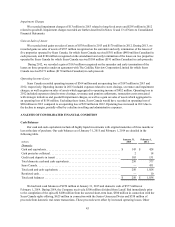
Impairment charges
Kmart recorded impairment charges of $70 million and $10 million in 2013 and 2012, respectively, related to
impairment of long-lived assets. Impairment charges recorded during 2013 and 2012 are further described in Note
13 of Notes to Consolidated Financial Statements.