Sears 2014 Annual Report Download - page 89
Download and view the complete annual report
Please find page 89 of the 2014 Sears annual report below. You can navigate through the pages in the report by either clicking on the pages listed below, or by using the keyword search tool below to find specific information within the annual report.-
 1
1 -
2
-
3
-
4
-
5
-
6
-
7
-
8
-
9
-
10
-
11
-
12
-
13
-
14
-
15
-
16
-
17
-
18
-
19
-
20
-
21
-
22
-
23
-
24
-
25
-
26
-
27
-
28
-
29
-
30
-
31
-
32
-
33
-
34
-
35
-
36
-
37
-
38
-
39
-
40
-
41
-
42
-
43
-
44
-
45
-
46
-
47
-
48
-
49
-
50
-
51
-
52
-
53
-
54
-
55
-
56
-
57
-
58
-
59
-
60
-
61
-
62
-
63
-
64
-
65
-
66
-
67
-
68
-
69
-
70
-
71
-
72
-
73
-
74
-
75
-
76
-
77
-
78
-
 79
79 -
 80
80 -
 81
81 -
 82
82 -
 83
83 -
 84
84 -
 85
85 -
 86
86 -
 87
87 -
 88
88 -
 89
89 -
 90
90 -
 91
91 -
 92
92 -
 93
93 -
 94
94 -
 95
95 -
 96
96 -
 97
97 -
 98
98 -
 99
99 -
100
-
101
-
102
-
103
-
104
-
105
-
106
-
107
-
108
-
109
-
110
-
111
-
112
-
113
-
114
-
115
-
116
-
117
-
118
-
119
-
120
-
121
-
122
-
123
-
124
-
125
-
126
-
127
-
128
-
129
-
130
-
131
-
132
-
133
-
134
-
135
-
136
-
137
-
138
-
139
-
140
-
141
-
142
-
143
 |
 |

SEARS HOLDINGS CORPORATION
Notes to Consolidated Financial Statements—(Continued)
89
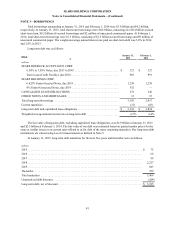
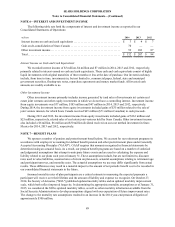
NOTE 6—INTEREST AND INVESTMENT INCOME
The following table sets forth the components of interest and investment income as reported in our
Consolidated Statements of Operations:
millions 2014 2013 2012
Interest income on cash and cash equivalents . . . . . . . . . . . . . . . . . . . . . . . . . . . . . . . . . $ 3 $ 4 $ 7
Gain on de-consolidation of Sears Canada . . . . . . . . . . . . . . . . . . . . . . . . . . . . . . . . . . . 70 — —
Other investment income. . . . . . . . . . . . . . . . . . . . . . . . . . . . . . . . . . . . . . . . . . . . . . . . . 59 203 87
Total. . . . . . . . . . . . . . . . . . . . . . . . . . . . . . . . . . . . . . . . . . . . . . . . . . . . . . . . . . . . . . . . . $ 132 $ 207 $ 94
Interest Income on Cash and Cash Equivalents
We recorded interest income of $3 million, $4 million and $7 million in 2014, 2013 and 2012, respectively,
primarily related to interest earned on cash and cash equivalents. These cash and cash equivalents consist of highly
liquid investments with original maturities of three months or less at the date of purchase. Our invested cash may
include, from time to time, investments in, but not limited to, commercial paper, federal, state and municipal
government securities, floating-rate notes, repurchase agreements and money market funds. All invested cash
amounts are readily available to us.
Other Investment Income
Other investment income primarily includes income generated by (and sales of investments in) certain real
estate joint ventures and other equity investments in which we do not have a controlling interest. Investment income
from equity investments was $37 million, $185 million and $47 million in 2014, 2013 and 2012, respectively.
During 2014, the investment income from equity investments included gains of $35 million related to the sale of
joint venture interests for which Sears Canada received $65 million ($71 million Canadian) in cash proceeds.
During 2013 and 2012, the investment income from equity investments included gains of $163 million and
$25 million, respectively, related sales of real estate joint ventures held by Sears Canada. Other investment income
also included a $6 million, $6 million and $30 million dividend received on our cost method investment in Sears
Mexico for 2014, 2013 and 2012, respectively.
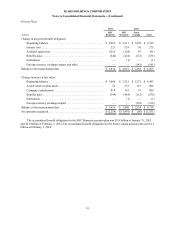
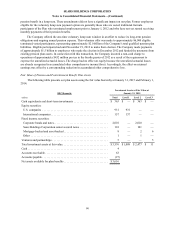
NOTE 7—BENEFIT PLANS
We sponsor a number of pension and postretirement benefit plans. We account for our retirement programs in
accordance with employers' accounting for defined benefit pension and other postretirement plans under Generally
Accepted Accounting Principles ("GAAP"). GAAP requires that amounts recognized in financial statements be
determined using an actuarial basis. As a result, our pension benefit programs are based on a number of statistical
and judgmental assumptions that attempt to anticipate future events and are used in calculating the expense and
liability related to our plans each year at January 31. These assumptions include, but are not limited to, discount
rates used to value liabilities, assumed rates of return on plan assets, actuarial assumptions relating to retirement age
and participant turnover, and mortality rates. The actuarial assumptions we use may differ significantly from actual
results. These differences may result in a material impact to the amount of net periodic benefit cost to be recorded in
our consolidated financial statements in the future.
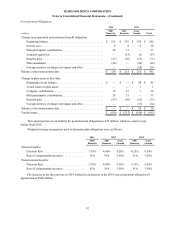
Assumed mortality rates of plan participants are a critical estimate in measuring the expected payments a
participant will receive over their lifetime and the amount of liability and expense we recognize. On October 27,
2014, the Society of Actuaries ("SOA") published updated mortality tables and an updated mortality improvement
scale, which both reflect improved longevity. In determining the appropriate mortality assumptions as of January 31,
2015, we considered the SOA’s updated mortality tables, as well as other mortality information available from the
Social Security Administration to develop assumptions aligned with our expectation of future improvement rates.
The change to the mortality rate assumptions resulted in an increase in the 2014 year-end pension obligation of
approximately $300 million.