Sears 2013 Annual Report Download - page 92
Download and view the complete annual report
Please find page 92 of the 2013 Sears annual report below. You can navigate through the pages in the report by either clicking on the pages listed below, or by using the keyword search tool below to find specific information within the annual report.-
 1
1 -
2
-
3
-
4
-
5
-
6
-
7
-
8
-
9
-
10
-
11
-
12
-
13
-
14
-
15
-
16
-
17
-
18
-
19
-
20
-
21
-
22
-
23
-
24
-
25
-
26
-
27
-
28
-
29
-
30
-
31
-
32
-
33
-
34
-
35
-
36
-
37
-
38
-
39
-
40
-
41
-
42
-
43
-
44
-
45
-
46
-
47
-
48
-
49
-
50
-
51
-
52
-
53
-
54
-
55
-
56
-
57
-
58
-
59
-
60
-
61
-
62
-
63
-
64
-
65
-
66
-
67
-
68
-
69
-
70
-
71
-
72
-
73
-
74
-
75
-
76
-
77
-
78
-
79
-
80
-
81
-
 82
82 -
 83
83 -
 84
84 -
 85
85 -
 86
86 -
 87
87 -
 88
88 -
 89
89 -
 90
90 -
 91
91 -
 92
92 -
 93
93 -
 94
94 -
 95
95 -
 96
96 -
 97
97 -
 98
98 -
 99
99 -
 100
100 -
 101
101 -
 102
102 -
103
-
104
-
105
-
106
-
107
-
108
-
109
-
110
-
111
-
112
-
113
-
114
-
115
-
116
-
117
-
118
-
119
-
120
-
121
-
122
-
123
-
124
-
125
-
126
-
127
-
128
-
129
-
130
-
131
-
132
-
133
-
134
-
135
-
136
-
137
 |
 |

SEARS HOLDINGS CORPORATION
Notes to Consolidated Financial Statements—(Continued)
92
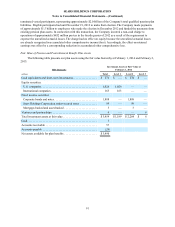
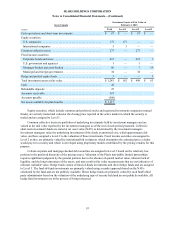
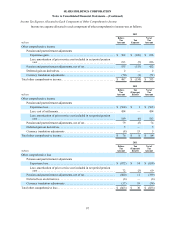
Investment Assets at Fair Value at
SHC Domestic February 2, 2013
millions Total Level 1 Level 2 Level 3
Cash equivalents and short-term investments . . . . . . . . . . . . . . . . . . . . $ 187 $ — $ 187 $ —
Equity securities:
U.S. companies . . . . . . . . . . . . . . . . . . . . . . . . . . . . . . . . . . . . . . . . . . 848 848 — —
International companies . . . . . . . . . . . . . . . . . . . . . . . . . . . . . . . . . . . 138 138 — —
Registered investment companies. . . . . . . . . . . . . . . . . . . . . . . . . . . . 1 1 — —
Fixed income securities:
Corporate bonds and notes . . . . . . . . . . . . . . . . . . . . . . . . . . . . . . . . . 1,840 — 1,840 —
Sears Holdings Corporation senior secured notes. . . . . . . . . . . . . . . . 176 — 176 —
U.S. government and agencies . . . . . . . . . . . . . . . . . . . . . . . . . . . . . . 1 — 1 —
Mortgage-backed and asset-backed . . . . . . . . . . . . . . . . . . . . . . . . . . 6 — 6 —
Ventures and partnerships . . . . . . . . . . . . . . . . . . . . . . . . . . . . . . . . . . . 12 — — 12
Total investment assets at fair value . . . . . . . . . . . . . . . . . . . . . . . . . . . $ 3,209 $ 987 $ 2,210 $ 12
Accounts receivable. . . . . . . . . . . . . . . . . . . . . . . . . . . . . . . . . . . . . . . . 44
Accounts payable. . . . . . . . . . . . . . . . . . . . . . . . . . . . . . . . . . . . . . . . . . (32)
Net assets available for plan benefits . . . . . . . . . . . . . . . . . . . . . . . . . . $ 3,221
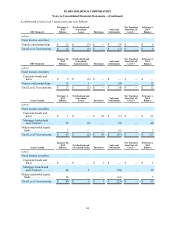
Investment Assets at Fair Value at
Sears Canada February 1, 2014
millions Total Level 1 Level 2 Level 3
Cash equivalents and short-term investments . . . . . . . . . . . . . . . . . . . . $ 107 $ — $ 107 $ —
Equity securities:
U.S. companies . . . . . . . . . . . . . . . . . . . . . . . . . . . . . . . . . . . . . . . . . . 152 152 — —
International companies . . . . . . . . . . . . . . . . . . . . . . . . . . . . . . . . . . . 3 3 — —
Common collective trusts . . . . . . . . . . . . . . . . . . . . . . . . . . . . . . . . . . . 264 — 264 —
Fixed income securities:
Corporate bonds and notes . . . . . . . . . . . . . . . . . . . . . . . . . . . . . . . . . 617 — 554 63
Mortgage-backed and asset-backed . . . . . . . . . . . . . . . . . . . . . . . . . . 54 — 6 48
Municipal and foreign government. . . . . . . . . . . . . . . . . . . . . . . . . . . 14 — 14 —
Hedge and pooled equity funds. . . . . . . . . . . . . . . . . . . . . . . . . . . . . . . 2 — — 2
Total investment assets at fair value . . . . . . . . . . . . . . . . . . . . . . . . . . . $ 1,213 $ 155 $ 945 $ 113
Cash. . . . . . . . . . . . . . . . . . . . . . . . . . . . . . . . . . . . . . . . . . . . . . . . . . . . 31
Refundable deposits. . . . . . . . . . . . . . . . . . . . . . . . . . . . . . . . . . . . . . . . 22
Accounts receivable. . . . . . . . . . . . . . . . . . . . . . . . . . . . . . . . . . . . . . . . 347
Accounts payable. . . . . . . . . . . . . . . . . . . . . . . . . . . . . . . . . . . . . . . . . . (369)
Net assets available for plan benefits . . . . . . . . . . . . . . . . . . . . . . . . . . $ 1,244