Sears 2013 Annual Report Download - page 27
Download and view the complete annual report
Please find page 27 of the 2013 Sears annual report below. You can navigate through the pages in the report by either clicking on the pages listed below, or by using the keyword search tool below to find specific information within the annual report.-
 1
1 -
2
-
3
-
4
-
5
-
6
-
7
-
8
-
9
-
10
-
11
-
12
-
13
-
14
-
15
-
16
-
 17
17 -
 18
18 -
 19
19 -
 20
20 -
 21
21 -
 22
22 -
 23
23 -
 24
24 -
 25
25 -
 26
26 -
 27
27 -
 28
28 -
 29
29 -
 30
30 -
 31
31 -
 32
32 -
 33
33 -
 34
34 -
 35
35 -
 36
36 -
 37
37 -
38
-
39
-
40
-
41
-
42
-
43
-
44
-
45
-
46
-
47
-
48
-
49
-
50
-
51
-
52
-
53
-
54
-
55
-
56
-
57
-
58
-
59
-
60
-
61
-
62
-
63
-
64
-
65
-
66
-
67
-
68
-
69
-
70
-
71
-
72
-
73
-
74
-
75
-
76
-
77
-
78
-
79
-
80
-
81
-
82
-
83
-
84
-
85
-
86
-
87
-
88
-
89
-
90
-
91
-
92
-
93
-
94
-
95
-
96
-
97
-
98
-
99
-
100
-
101
-
102
-
103
-
104
-
105
-
106
-
107
-
108
-
109
-
110
-
111
-
112
-
113
-
114
-
115
-
116
-
117
-
118
-
119
-
120
-
121
-
122
-
123
-
124
-
125
-
126
-
127
-
128
-
129
-
130
-
131
-
132
-
133
-
134
-
135
-
136
-
137
 |
 |

27
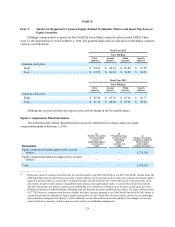
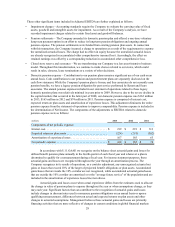
Adjusted EBITDA was determined as follows:
millions 2013 2012 2011
Net loss attributable to SHC per statement of operations . . . . . . . . . . . $ (1,365) $ (930) $ (3,140)
Income (loss) attributable to noncontrolling interests . . . . . . . . . . . . . . 249 (124)(7)
Loss from discontinued operations, net of tax. . . . . . . . . . . . . . . . . . . . — — 27
Income tax expense . . . . . . . . . . . . . . . . . . . . . . . . . . . . . . . . . . . . . . . . 144 44 1,369
Interest expense . . . . . . . . . . . . . . . . . . . . . . . . . . . . . . . . . . . . . . . . . . . 254 267 289
Interest and investment income . . . . . . . . . . . . . . . . . . . . . . . . . . . . . . . (207) (94)(41)
Other (income) loss . . . . . . . . . . . . . . . . . . . . . . . . . . . . . . . . . . . . . . . . (2) (1) 2
Operating loss . . . . . . . . . . . . . . . . . . . . . . . . . . . . . . . . . . . . . . . . . . . . (927) (838)(1,501)
Depreciation and amortization. . . . . . . . . . . . . . . . . . . . . . . . . . . . . . . . 732 830 853
Gain on sales of assets . . . . . . . . . . . . . . . . . . . . . . . . . . . . . . . . . . . . . . (667) (468)(64)
Before excluded items . . . . . . . . . . . . . . . . . . . . . . . . . . . . . . . . . . . . . . (862) (476)(712)
Impairment charges . . . . . . . . . . . . . . . . . . . . . . . . . . . . . . . . . . . . . . . . 233 330 649
Domestic pension expense. . . . . . . . . . . . . . . . . . . . . . . . . . . . . . . . . . . 162 165 74
Closed store reserve, severance and other . . . . . . . . . . . . . . . . . . . . . . . 130 140 254
Pension settlements . . . . . . . . . . . . . . . . . . . . . . . . . . . . . . . . . . . . . . . . — 455 —
Transaction costs . . . . . . . . . . . . . . . . . . . . . . . . . . . . . . . . . . . . . . . . . . — 12 —
Hurricane losses. . . . . . . . . . . . . . . . . . . . . . . . . . . . . . . . . . . . . . . . . . . — — 12
Adjusted EBITDA . . . . . . . . . . . . . . . . . . . . . . . . . . . . . . . . . . . . . . . . . (337) 626 277
SHO Separation . . . . . . . . . . . . . . . . . . . . . . . . . . . . . . . . . . . . . . . . . . . —(90)(81)
Adjusted EBITDA as defined . . . . . . . . . . . . . . . . . . . . . . . . . . . . . . . . $ (337) $ 536 $ 196
% to revenues. . . . . . . . . . . . . . . . . . . . . . . . . . . . . . . . . . . . . . . . . . . . . (0.9)% 1.4% 0.5%
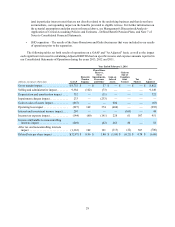
Adjusted EBITDA for our segments was as follows:
2013 2012 2011
millions Kmart Sears
Domestic Sears
Canada Sears
Holdings Kmart Sears
Domestic Sears
Canada Sears
Holdings Kmart Sears
Domestic Sears
Canada Sears
Holdings
Operating income (loss) per
statement of operations . . . . . . . . $ (351) $ (940) $ 364 $ (927) $ 5 $ (656) $ (187) $ (838) $ (34) $(1,447) $ (20) $(1,501)
Depreciation and amortization . . . . . 129 511 92 732 147 578 105 830 149 601 103 853
Gain on sales of assets . . . . . . . . . . . (66) (63) (538) (667) (37) (261) (170) (468) (34) (30) — (64)
Before excluded items . . . . . . . . . . . (288) (492) (82) (862) 115 (339) (252) (476) 81 (876) 83 (712)
Impairment charges . . . . . . . . . . . . . 70 150 13 233 10 25 295 330 15 634 — 649
Domestic pension expense . . . . . . . . — 162 — 162 — 165 — 165 — 74 — 74
Closed store reserve, severance and
other . . . . . . . . . . . . . . . . . . . . . . . 89 (31) 72 130 76 44 20 140 76 160 18 254
Pension settlements . . . . . . . . . . . . . — — — — — 452 3 455 — — — —
Transaction costs . . . . . . . . . . . . . . . — — — — — 9 3 12 — — — —
Hurricane losses . . . . . . . . . . . . . . . . — — — — — — — — — 12 — 12
Adjusted EBITDA . . . . . . . . . . . . . . (129) (211) 3 (337) 201 356 69 626 172 4 101 277
SHO Separation . . . . . . . . . . . . . . . . — — — — — (90) — (90) — (81) — (81)
Adjusted EBITDA as defined. . . . . . $ (129) $ (211) $ 3 $ (337) $ 201 $ 266 $ 69 $ 536 $ 172 $ (77) $ 101 $ 196
% to revenues . . . . . . . . . . . . . . . . . . (1.0)% (1.1)% 0.1% (0.9)% 1.4% 1.4% 1.6% 1.4% 1.1% (0.4)% 2.2% 0.5%