Sears 2013 Annual Report Download - page 85
Download and view the complete annual report
Please find page 85 of the 2013 Sears annual report below. You can navigate through the pages in the report by either clicking on the pages listed below, or by using the keyword search tool below to find specific information within the annual report.-
 1
1 -
2
-
3
-
4
-
5
-
6
-
7
-
8
-
9
-
10
-
11
-
12
-
13
-
14
-
15
-
16
-
17
-
18
-
19
-
20
-
21
-
22
-
23
-
24
-
25
-
26
-
27
-
28
-
29
-
30
-
31
-
32
-
33
-
34
-
35
-
36
-
37
-
38
-
39
-
40
-
41
-
42
-
43
-
44
-
45
-
46
-
47
-
48
-
49
-
50
-
51
-
52
-
53
-
54
-
55
-
56
-
57
-
58
-
59
-
60
-
61
-
62
-
63
-
64
-
65
-
66
-
67
-
68
-
69
-
70
-
71
-
72
-
73
-
74
-
 75
75 -
 76
76 -
 77
77 -
 78
78 -
 79
79 -
 80
80 -
 81
81 -
 82
82 -
 83
83 -
 84
84 -
 85
85 -
 86
86 -
 87
87 -
 88
88 -
 89
89 -
 90
90 -
 91
91 -
 92
92 -
 93
93 -
 94
94 -
 95
95 -
96
-
97
-
98
-
99
-
100
-
101
-
102
-
103
-
104
-
105
-
106
-
107
-
108
-
109
-
110
-
111
-
112
-
113
-
114
-
115
-
116
-
117
-
118
-
119
-
120
-
121
-
122
-
123
-
124
-
125
-
126
-
127
-
128
-
129
-
130
-
131
-
132
-
133
-
134
-
135
-
136
-
137
 |
 |

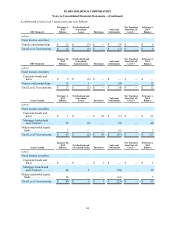
SEARS HOLDINGS CORPORATION
Notes to Consolidated Financial Statements—(Continued)
85
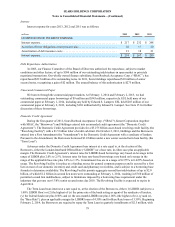
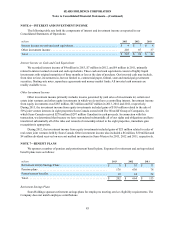
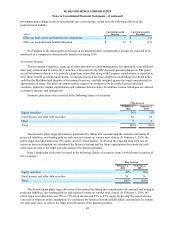
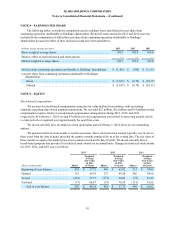
NOTE 6—INTEREST AND INVESTMENT INCOME
The following table sets forth the components of interest and investment income as reported in our
Consolidated Statements of Operations:
millions 2013 2012 2011
Interest income on cash and cash equivalents. . . . . . . . . . . . . . . . . . . . . . . . . . . . . . . $ 4 $ 7 $ 4
Other investment income . . . . . . . . . . . . . . . . . . . . . . . . . . . . . . . . . . . . . . . . . . . . . . 203 87 37
Total. . . . . . . . . . . . . . . . . . . . . . . . . . . . . . . . . . . . . . . . . . . . . . . . . . . . . . . . . . . . . . . $ 207 $ 94 $ 41
Interest Income on Cash and Cash Equivalents
We recorded interest income of $4 million in 2013, $7 million in 2012, and $4 million in 2011, primarily
related to interest earned on cash and cash equivalents. These cash and cash equivalents consist of highly liquid
investments with original maturities of three months or less at the date of purchase. Our invested cash may include,
from time to time, investments in, but not limited to, commercial paper, federal, state and municipal government
securities, floating-rate notes, repurchase agreements and money market funds. All invested cash amounts are
readily available to us.
Other Investment Income
Other investment income primarily includes income generated by (and sales of investments in) certain real
estate joint ventures and other equity investments in which we do not have a controlling interest. Investment income
from equity investments was $185 million, $47 million and $27 million in 2013, 2012 and 2011, respectively.
During 2013, the investment income from equity investments included gains of $163 million related to the sale of
50% joint venture interests in eight properties Sears Canada owned with The Westcliff Group of Companies, for
which Sears Canada received $270 million ($297 million Canadian) in cash proceeds. In connection with this
transaction, we determined that because we have surrendered substantially all of our rights and obligations and have
transferred substantially all of the risks and rewards of ownership related to the eight properties, immediate gain
recognition is appropriate.
During 2012, the investment income from equity investments included gains of $25 million related to sales of
real estate joint ventures held by Sears Canada. Other investment income also included a $6 million, $30 million and
$4 million dividend received on our cost method investment in Sears Mexico for 2013, 2012 and 2011, respectively.
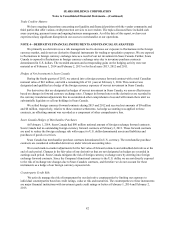
NOTE 7—BENEFIT PLANS
We sponsor a number of pension and postretirement benefit plans. Expenses for retirement and savings-related
benefit plans were as follows:
millions 2013 2012 2011
Retirement/401(k) Savings Plans . . . . . . . . . . . . . . . . . . . . . . . . . . . . . . . . . $ 8 $ 10 $ 11
Pension plans . . . . . . . . . . . . . . . . . . . . . . . . . . . . . . . . . . . . . . . . . . . . . . . . 176 630 78
Postretirement benefits . . . . . . . . . . . . . . . . . . . . . . . . . . . . . . . . . . . . . . . . . 18 24 24
Total . . . . . . . . . . . . . . . . . . . . . . . . . . . . . . . . . . . . . . . . . . . . . . . . . . . . . . . $ 202 $ 664 $ 113
Retirement Savings Plans
Sears Holdings sponsors retirement savings plans for employees meeting service eligibility requirements. The
Company does not match employee contributions.