Sears 2013 Annual Report Download - page 30
Download and view the complete annual report
Please find page 30 of the 2013 Sears annual report below. You can navigate through the pages in the report by either clicking on the pages listed below, or by using the keyword search tool below to find specific information within the annual report.-
 1
1 -
2
-
3
-
4
-
5
-
6
-
7
-
8
-
9
-
10
-
11
-
12
-
13
-
14
-
15
-
16
-
17
-
18
-
19
-
 20
20 -
 21
21 -
 22
22 -
 23
23 -
 24
24 -
 25
25 -
 26
26 -
 27
27 -
 28
28 -
 29
29 -
 30
30 -
 31
31 -
 32
32 -
 33
33 -
 34
34 -
 35
35 -
 36
36 -
 37
37 -
 38
38 -
 39
39 -
 40
40 -
41
-
42
-
43
-
44
-
45
-
46
-
47
-
48
-
49
-
50
-
51
-
52
-
53
-
54
-
55
-
56
-
57
-
58
-
59
-
60
-
61
-
62
-
63
-
64
-
65
-
66
-
67
-
68
-
69
-
70
-
71
-
72
-
73
-
74
-
75
-
76
-
77
-
78
-
79
-
80
-
81
-
82
-
83
-
84
-
85
-
86
-
87
-
88
-
89
-
90
-
91
-
92
-
93
-
94
-
95
-
96
-
97
-
98
-
99
-
100
-
101
-
102
-
103
-
104
-
105
-
106
-
107
-
108
-
109
-
110
-
111
-
112
-
113
-
114
-
115
-
116
-
117
-
118
-
119
-
120
-
121
-
122
-
123
-
124
-
125
-
126
-
127
-
128
-
129
-
130
-
131
-
132
-
133
-
134
-
135
-
136
-
137
 |
 |

30
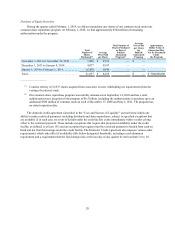
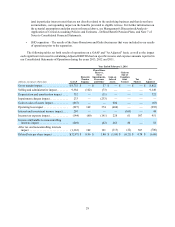
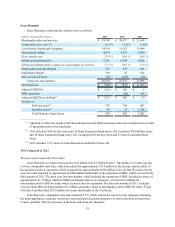
Year Ended February 2, 2013
millions, except per share
data GAAP
Domestic
Pension
Expense
Closed Store
Reserve, Store
Impairments
and Severance
Gain on
Sales of
Assets Transaction
Costs Goodwill
Impairment Pension
Settlements
Gain on
Sale of
Canadian
Joint
Venture Tax
Matters As Adjusted
- Reported SHO
Separation As
Adjusted(1)
Gross margin impact. . . $10,514 $ — $ 35 $ — $ — $ — $ — $ — $ — $ 10,549 $ (432) $ 10,117
Selling and
administrative
impact . . . . . . . . . . . 10,660 (165) (105) — (12) — (455) — — 9,923 (343) 9,580
Depreciation and
amortization impact.830 — (22) — — — — — — 808 (6) 802
Impairment charges
impact . . . . . . . . . . . 330 — (35) — — (295) — — — — — —
Gain on sales of assets
impact . . . . . . . . . . . (468) — — 419 — — — — — (49) — (49)
Operating loss impact. . (838) 165 197 (419) 12 295 455 — — (133) (83) (216)
Interest and investment
income impact. . . . . 94 — — — — — — (25) — 69 — 69
Income tax expense
impact . . . . . . . . . . . (44) (62) (74) 157 (5) — — 9 143 124 33 157
Loss attributable to
noncontrolling
interests impact . . . . 124 — (7) 8 — (145) (1) 12 — (9) — (9)
After tax and
noncontrolling
interests impact . . . . (930) 103 116 (254) 7 150 454 (4) 143 (215) (51) (266)
Diluted loss per share
impact . . . . . . . . . . . $ (8.78) $ 0.97 $ 1.09 $ (2.40) $ 0.07 $ 1.42 $ 4.29 $ (0.04) $ 1.35 $ (2.03) $ (0.48) $ (2.51)
(1) Adjusted to reflect the results of the Sears Hometown and Outlet businesses that were included in our results of operations
prior to the separation.
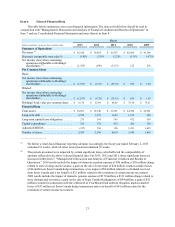
Year Ended January 28, 2012
millions, except per share data GAAP
Domestic
Pension
Expense
Closed Store
Reserve,
Store
Impairments
and
Severance
Mark-
to-
Market
Losses
Gain on
Sales of
Assets Hurricane
Losses Goodwill
Impairment Tax
Matters Discontinued
Operations
As
Adjusted -
Reported SHO
Separation As
Adjusted(1)
Gross margin impact . . . . . . . . . $10,601 $ — $ 130 $ — $ — $ — $ — — $ — $ 10,731 $ (524) $ 10,207
Selling and administrative
impact. . . . . . . . . . . . . . . . . . 10,664 (74) (124) — — (12) — — — 10,454 (459) 9,995
Depreciation and amortization
impact. . . . . . . . . . . . . . . . . . 853 — (8) — — — — — — 845 (10) 835
Impairment charges impact . . . . 649 — (98) — — — (551) — — — — —
Gain on sales of assets impact. . (64) — — — 33 — — — — (31) — (31)
Operating loss impact . . . . . . . . (1,501) 74 360 — (33) 12 551 — — (537) (55) (592)
Other loss impact. . . . . . . . . . . . (2) — — 6 — — — — — 4 — 4
Income tax expense impact . . . . (1,369) (28) (134) (2) 13 (5) — 1,819 — 294 22 316
Loss from discontinued
operations, net of tax impact (27) — — — — — — — 27 — — —
Loss attributable to
noncontrolling interest
impact. . . . . . . . . . . . . . . . . . 7 — (1) (1) — — — — — 5 — 5
After tax and noncontrolling
interest impact . . . . . . . . . . . (3,140) 46 225 3 (20) 7 551 1,819 27 (482) (33) (515)
Diluted loss per share impact. . . $ (29.40) $ 0.43 $ 2.10 $ 0.03 $ (0.19) $ 0.07 $ 5.16 $ 17.03 $ 0.25 $ (4.52) $ (0.31) $ (4.83)
(1) Adjusted to reflect the results of the Sears Hometown and Outlet businesses that were included in our results of operations
prior to the separation.
We also believe that our use of Adjusted EPS provides an appropriate measure for investors to use in assessing
our performance across periods, given that this measure provides an adjustment for certain significant items which
may vary significantly from period to period, improving the comparability of year-to-year results and is therefore
representative of our ongoing performance. Therefore, we have adjusted our results for them to make our statements
more useful and comparable. However, we do not, and do not recommend that you, solely use Adjusted EPS to
assess our financial and earnings performance. We also use, and recommend that you use, diluted earnings per share
in addition to Adjusted EPS in assessing our earnings performance.