Sears 2013 Annual Report Download - page 37
Download and view the complete annual report
Please find page 37 of the 2013 Sears annual report below. You can navigate through the pages in the report by either clicking on the pages listed below, or by using the keyword search tool below to find specific information within the annual report.-
 1
1 -
2
-
3
-
4
-
5
-
6
-
7
-
8
-
9
-
10
-
11
-
12
-
13
-
14
-
15
-
16
-
17
-
18
-
19
-
20
-
21
-
22
-
23
-
24
-
25
-
26
-
 27
27 -
 28
28 -
 29
29 -
 30
30 -
 31
31 -
 32
32 -
 33
33 -
 34
34 -
 35
35 -
 36
36 -
 37
37 -
 38
38 -
 39
39 -
 40
40 -
 41
41 -
 42
42 -
 43
43 -
 44
44 -
 45
45 -
 46
46 -
 47
47 -
48
-
49
-
50
-
51
-
52
-
53
-
54
-
55
-
56
-
57
-
58
-
59
-
60
-
61
-
62
-
63
-
64
-
65
-
66
-
67
-
68
-
69
-
70
-
71
-
72
-
73
-
74
-
75
-
76
-
77
-
78
-
79
-
80
-
81
-
82
-
83
-
84
-
85
-
86
-
87
-
88
-
89
-
90
-
91
-
92
-
93
-
94
-
95
-
96
-
97
-
98
-
99
-
100
-
101
-
102
-
103
-
104
-
105
-
106
-
107
-
108
-
109
-
110
-
111
-
112
-
113
-
114
-
115
-
116
-
117
-
118
-
119
-
120
-
121
-
122
-
123
-
124
-
125
-
126
-
127
-
128
-
129
-
130
-
131
-
132
-
133
-
134
-
135
-
136
-
137
 |
 |
37
Operating Income (Loss)
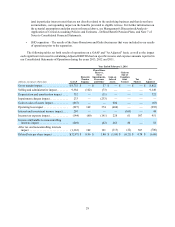
Kmart recorded an operating loss of $351 million in 2013 as compared to operating income of $5 million in
2012. Operating loss in 2013 included expenses related to store closings, store impairments and severance, as well
as gains on the sales of assets which aggregated to an operating loss of $144 million. Operating income in 2012 also
included expenses related to store closings, store impairments and severance, as well as gains on sales of assets
which aggregated to an operating loss of $84 million. Excluding these items, Kmart would have reported an
operating loss of $207 million in 2013 as compared to operating income of $89 million in 2012. This decline in
operating performance was primarily the result of the above noted declines in sales and gross margin, partially offset
by a decrease in selling and administrative expenses.
2012 Compared to 2011
Revenues and Comparable Store Sales
Kmart’s revenues decreased by $718 million to $14.6 billion as comparable store sales decreased 3.7% in
2012, which accounted for approximately $540 million of the decline. The decrease in revenue was also due to the
impact of Kmart having fewer stores in operation during 2012, which accounted for approximately $400 million of
the decline. These declines were partially offset by the inclusion of approximately $190 million of revenues
recorded in the 53rd week of 2012.
The decrease in comparable store sales of 3.7% reflects decreases in a majority of its categories, most notably
in the consumer electronics, pharmacy, grocery and household, and drug store categories. Excluding the consumer
electronics category, Kmart comparable store sales decreased 2.8%. The decrease in consumer electronics sales
continue to be negatively impacted by price compression as well as market shifts such as moves to smartphone
technology and away from digital cameras, GPS devices, MP3 players and camcorders in addition to transitions to
online gaming and applications while the decrease in pharmacy sales was driven by the conversion of brand name
drugs to equivalent generic drugs. The decrease in the grocery and household category was primarily attributable to
competitive pressures in this category.
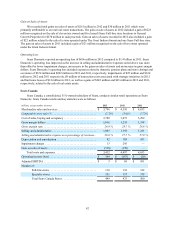
Gross Margin
Kmart generated $3.4 billion in gross margin in 2012 and $3.5 billion in 2011. The decrease in Kmart’s gross
margin is due to the above noted decrease in sales which was partially offset an improvement in gross margin rate
and included $21 million and $46 million for markdowns recorded in connection with store closings during 2012
and 2011, respectively.
Kmart’s gross margin rate increased 70 basis points to 23.4% in 2012 from 22.7% in 2011 mainly due to
improvements in the apparel, pharmacy and toys categories which were partially offset by a decline in the consumer
electronics category.
Selling and Administrative Expenses
Kmart’s selling and administrative expenses decreased $87 million in 2012. The decrease primarily reflects
decreases in payroll and advertising expenses. Selling and administrative expenses for 2012 and 2011 were impacted
by expenses of $55 million and $30 million, respectively, related to store closings and severance.
Kmart’s selling and administrative expense rate was 22.5% in 2012 and 22.1% in 2011 and increased primarily
as a result of lower expense leverage due to the sales decline noted above.
Depreciation and Amortization
Depreciation and amortization expense decreased $2 million in 2012 to $147 million and included $9 million
of charges taken in connection with store closings. The decrease is primarily due to having fewer assets to
depreciate.