Sears 2013 Annual Report Download - page 116
Download and view the complete annual report
Please find page 116 of the 2013 Sears annual report below. You can navigate through the pages in the report by either clicking on the pages listed below, or by using the keyword search tool below to find specific information within the annual report.-
 1
1 -
2
-
3
-
4
-
5
-
6
-
7
-
8
-
9
-
10
-
11
-
12
-
13
-
14
-
15
-
16
-
17
-
18
-
19
-
20
-
21
-
22
-
23
-
24
-
25
-
26
-
27
-
28
-
29
-
30
-
31
-
32
-
33
-
34
-
35
-
36
-
37
-
38
-
39
-
40
-
41
-
42
-
43
-
44
-
45
-
46
-
47
-
48
-
49
-
50
-
51
-
52
-
53
-
54
-
55
-
56
-
57
-
58
-
59
-
60
-
61
-
62
-
63
-
64
-
65
-
66
-
67
-
68
-
69
-
70
-
71
-
72
-
73
-
74
-
75
-
76
-
77
-
78
-
79
-
80
-
81
-
82
-
83
-
84
-
85
-
86
-
87
-
88
-
89
-
90
-
91
-
92
-
93
-
94
-
95
-
96
-
97
-
98
-
99
-
100
-
101
-
102
-
103
-
104
-
105
-
 106
106 -
 107
107 -
 108
108 -
 109
109 -
 110
110 -
 111
111 -
 112
112 -
 113
113 -
 114
114 -
 115
115 -
 116
116 -
 117
117 -
 118
118 -
 119
119 -
 120
120 -
 121
121 -
 122
122 -
 123
123 -
 124
124 -
 125
125 -
 126
126 -
127
-
128
-
129
-
130
-
131
-
132
-
133
-
134
-
135
-
136
-
137
 |
 |
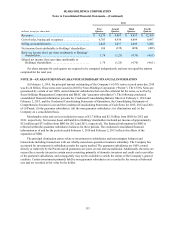
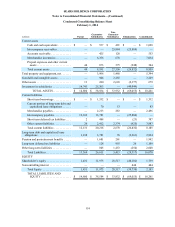
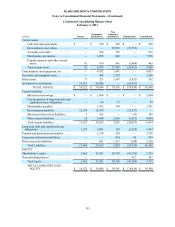
SEARS HOLDINGS CORPORATION
Notes to Consolidated Financial Statements—(Continued)
116
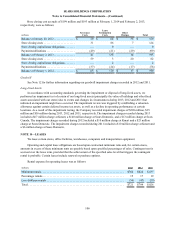
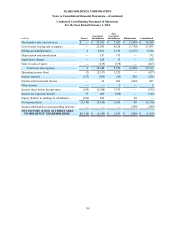
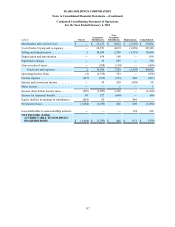
Condensed Consolidating Statement of Operations
For the Year Ended February 1, 2014
millions Parent Guarantor
Subsidiaries
Non-
Guarantor
Subsidiaries Eliminations Consolidated
Merchandise sales and services. . . . . . . . . . . . . . $ — $ 32,391 $ 7,202 $ (3,405) $ 36,188
Cost of sales, buying and occupancy . . . . . . . . . — 25,035 4,128 (1,730) 27,433
Selling and administrative. . . . . . . . . . . . . . . . . . 2 8,865 2,192 (1,675) 9,384
Depreciation and amortization . . . . . . . . . . . . . . — 557 175 — 732
Impairment charges. . . . . . . . . . . . . . . . . . . . . . . — 220 13 — 233
Gain on sales of assets . . . . . . . . . . . . . . . . . . . . —(129)(538) — (667)
Total costs and expenses . . . . . . . . . . . . . . . 2 34,548 5,970 (3,405) 37,115
Operating income (loss) . . . . . . . . . . . . . . . . . . . (2) (2,157) 1,232 — (927)
Interest expense. . . . . . . . . . . . . . . . . . . . . . . . . . (217) (394)(85) 442 (254)
Interest and investment income. . . . . . . . . . . . . . — 43 606 (442) 207
Other income. . . . . . . . . . . . . . . . . . . . . . . . . . . . — — 2 — 2
Income (loss) before income taxes . . . . . . . . . . . (219) (2,508) 1,755 — (972)
Income tax (expense) benefit . . . . . . . . . . . . . . . 37 469 (650) — (144)
Equity (deficit) in earnings in subsidiaries . . . . . (934) 894 — 40 —
Net income (loss) . . . . . . . . . . . . . . . . . . . . . . . . (1,116) (1,145) 1,105 40 (1,116)
Income attributable to noncontrolling interests .———(249)(249)
NET INCOME (LOSS) ATTRIBUTABLE
TO HOLDINGS’ SHAREHOLDERS. . . . . $(1,116) $ (1,145) $ 1,105 $ (209) $ (1,365)