Sears 2013 Annual Report Download - page 63
Download and view the complete annual report
Please find page 63 of the 2013 Sears annual report below. You can navigate through the pages in the report by either clicking on the pages listed below, or by using the keyword search tool below to find specific information within the annual report.-
 1
1 -
2
-
3
-
4
-
5
-
6
-
7
-
8
-
9
-
10
-
11
-
12
-
13
-
14
-
15
-
16
-
17
-
18
-
19
-
20
-
21
-
22
-
23
-
24
-
25
-
26
-
27
-
28
-
29
-
30
-
31
-
32
-
33
-
34
-
35
-
36
-
37
-
38
-
39
-
40
-
41
-
42
-
43
-
44
-
45
-
46
-
47
-
48
-
49
-
50
-
51
-
52
-
 53
53 -
 54
54 -
 55
55 -
 56
56 -
 57
57 -
 58
58 -
 59
59 -
 60
60 -
 61
61 -
 62
62 -
 63
63 -
 64
64 -
 65
65 -
 66
66 -
 67
67 -
 68
68 -
 69
69 -
 70
70 -
 71
71 -
 72
72 -
 73
73 -
74
-
75
-
76
-
77
-
78
-
79
-
80
-
81
-
82
-
83
-
84
-
85
-
86
-
87
-
88
-
89
-
90
-
91
-
92
-
93
-
94
-
95
-
96
-
97
-
98
-
99
-
100
-
101
-
102
-
103
-
104
-
105
-
106
-
107
-
108
-
109
-
110
-
111
-
112
-
113
-
114
-
115
-
116
-
117
-
118
-
119
-
120
-
121
-
122
-
123
-
124
-
125
-
126
-
127
-
128
-
129
-
130
-
131
-
132
-
133
-
134
-
135
-
136
-
137
 |
 |

63
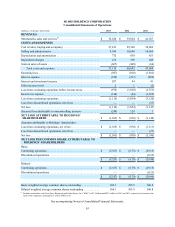
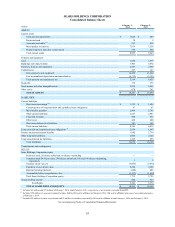
SEARS HOLDINGS CORPORATION
Consolidated Statements of Operations
millions, except per share data 2013 2012 2011
REVENUES
Merchandise sales and services(1) . . . . . . . . . . . . . . . . . . . . . . . . . . . . $ 36,188 $ 39,854 $ 41,567
COSTS AND EXPENSES
Cost of sales, buying and occupancy . . . . . . . . . . . . . . . . . . . . . . . . . 27,433 29,340 30,966
Selling and administrative . . . . . . . . . . . . . . . . . . . . . . . . . . . . . . . . . 9,384 10,660 10,664
Depreciation and amortization . . . . . . . . . . . . . . . . . . . . . . . . . . . . . . 732 830 853
Impairment charges . . . . . . . . . . . . . . . . . . . . . . . . . . . . . . . . . . . . . . 233 330 649
Gain on sales of assets . . . . . . . . . . . . . . . . . . . . . . . . . . . . . . . . . . . . (667)(468)(64)
Total costs and expenses . . . . . . . . . . . . . . . . . . . . . . . . . . . . . . . 37,115 40,692 43,068
Operating loss. . . . . . . . . . . . . . . . . . . . . . . . . . . . . . . . . . . . . . . . . . . (927)(838)(1,501)
Interest expense . . . . . . . . . . . . . . . . . . . . . . . . . . . . . . . . . . . . . . . . . (254)(267)(289)
Interest and investment income . . . . . . . . . . . . . . . . . . . . . . . . . . . . . 207 94 41
Other income (loss). . . . . . . . . . . . . . . . . . . . . . . . . . . . . . . . . . . . . . . 2 1 (2)
Loss from continuing operations before income taxes. . . . . . . . . . . . (972)(1,010)(1,751)
Income tax expense. . . . . . . . . . . . . . . . . . . . . . . . . . . . . . . . . . . . . . . (144)(44)(1,369)
Loss from continuing operations . . . . . . . . . . . . . . . . . . . . . . . . . . . . (1,116)(1,054)(3,120)
Loss from discontinued operations, net of tax . . . . . . . . . . . . . . . . . . — — (27)
Net loss . . . . . . . . . . . . . . . . . . . . . . . . . . . . . . . . . . . . . . . . . . . . . . . . (1,116)(1,054)(3,147)
(Income) loss attributable to noncontrolling interests . . . . . . . . . . . . (249) 124 7
NET LOSS ATTRIBUTABLE TO HOLDINGS’
SHAREHOLDERS. . . . . . . . . . . . . . . . . . . . . . . . . . . . . . . . . . . . . $(1,365) $ (930) $ (3,140)
Amounts attributable to Holdings’ shareholders:
Loss from continuing operations, net of tax. . . . . . . . . . . . . . . . . . . . $(1,365) $ (930) $ (3,113)
Loss from discontinued operations, net of tax . . . . . . . . . . . . . . . . . . — — (27)
Net loss . . . . . . . . . . . . . . . . . . . . . . . . . . . . . . . . . . . . . . . . . . . . . . . . $(1,365) $ (930) $ (3,140)
NET LOSS PER COMMON SHARE ATTRIBUTABLE TO
HOLDINGS’ SHAREHOLDERS
Basic:
Continuing operations. . . . . . . . . . . . . . . . . . . . . . . . . . . . . . . . . . . . . $(12.87) $ (8.78) $ (29.15)
Discontinued operations . . . . . . . . . . . . . . . . . . . . . . . . . . . . . . . . . . . — — (0.25)
$(12.87) $ (8.78) $ (29.40)
Diluted:
Continuing operations. . . . . . . . . . . . . . . . . . . . . . . . . . . . . . . . . . . . . $(12.87) $ (8.78) $ (29.15)
Discontinued operations . . . . . . . . . . . . . . . . . . . . . . . . . . . . . . . . . . . — — (0.25)
$(12.87) $ (8.78) $ (29.40)
Basic weighted average common shares outstanding. . . . . . . . . . . . . 106.1 105.9 106.8
Diluted weighted average common shares outstanding . . . . . . . . . . . 106.1 105.9 106.8
(1) Includes merchandise sales from Sears Hometown and Outlet Stores, Inc. ("SHO") of $1.5 billion and $437 million in 2013 and 2012, respectively. Pursuant to the
terms of the separation, merchandise is sold to SHO at cost.
See accompanying Notes to Consolidated Financial Statements.