Sears 2013 Annual Report Download - page 33
Download and view the complete annual report
Please find page 33 of the 2013 Sears annual report below. You can navigate through the pages in the report by either clicking on the pages listed below, or by using the keyword search tool below to find specific information within the annual report.-
 1
1 -
2
-
3
-
4
-
5
-
6
-
7
-
8
-
9
-
10
-
11
-
12
-
13
-
14
-
15
-
16
-
17
-
18
-
19
-
20
-
21
-
22
-
 23
23 -
 24
24 -
 25
25 -
 26
26 -
 27
27 -
 28
28 -
 29
29 -
 30
30 -
 31
31 -
 32
32 -
 33
33 -
 34
34 -
 35
35 -
 36
36 -
 37
37 -
 38
38 -
 39
39 -
 40
40 -
 41
41 -
 42
42 -
 43
43 -
44
-
45
-
46
-
47
-
48
-
49
-
50
-
51
-
52
-
53
-
54
-
55
-
56
-
57
-
58
-
59
-
60
-
61
-
62
-
63
-
64
-
65
-
66
-
67
-
68
-
69
-
70
-
71
-
72
-
73
-
74
-
75
-
76
-
77
-
78
-
79
-
80
-
81
-
82
-
83
-
84
-
85
-
86
-
87
-
88
-
89
-
90
-
91
-
92
-
93
-
94
-
95
-
96
-
97
-
98
-
99
-
100
-
101
-
102
-
103
-
104
-
105
-
106
-
107
-
108
-
109
-
110
-
111
-
112
-
113
-
114
-
115
-
116
-
117
-
118
-
119
-
120
-
121
-
122
-
123
-
124
-
125
-
126
-
127
-
128
-
129
-
130
-
131
-
132
-
133
-
134
-
135
-
136
-
137
 |
 |
33
costs, as well as the gains on sales of assets and operating income from SHO, which all aggregated to an operating
loss of $622 million. Excluding these items, operating loss increased $779 million in 2013 compared to 2012
primarily due to the above noted declines in revenues and gross margin rate, which were partially offset by a decline
in selling and administrative expenses.
Interest Expense
We incurred $254 million and $267 million in interest expense during 2013 and 2012, respectively. The
decrease is due to a lower average interest rate on outstanding borrowings in 2013.
Interest and Investment Income
We recorded interest and investment income of $207 million and $94 million during 2013 and 2012,
respectively. During 2013, investment income included a gain of $163 million related to the sale of 50% joint
venture interests in eight properties Sears Canada owned with The Westcliff Group of Companies, for which Sears
Canada received $270 million ($297 million Canadian) in cash proceeds.
Income Taxes
Our effective tax rate for 2013 was 14.8% compared to 4.4% in 2012. Our tax rate in 2013 continues to
reflect the effect of not recognizing the benefit of current period losses in certain domestic jurisdictions where it is
not more likely than not that such benefits would be realized. The 2013 rate was impacted unfavorably by an
additional valuation allowance on state separate entity deferred tax assets and favorably for the lower tax on the
Sears Canada gain on sales of assets, federal and state tax audit settlements and statute expirations. In addition, the
2013 rate included a partial tax benefit on the loss from continuing operations, which was exactly offset by income
tax expense on other comprehensive income.
2012 Compared to 2011
Net Loss from Continuing Operations Attributable to Holdings' Shareholders
We recorded a net loss from continuing operations attributable to Holdings' shareholders of $930 million
($8.78 loss per diluted share from continuing operations) and $3.1 billion ($29.15 loss per diluted share from
continuing operations) for 2012 and 2011, respectively. Our results for 2012 and 2011 were affected by a number of
significant items, including non-cash charges related to pension settlements and the impairment of goodwill balances
and a $1.8 billion non-cash charge to establish a valuation allowance against our domestic deferred tax assets in
2011. Our net loss from continuing operations as adjusted for these significant items was $215 million ($2.03 loss
per diluted share from continuing operations) for 2012 and $482 million ($4.52 loss per diluted share from
continuing operations) for 2011. The improvement in net loss for the year reflected an improvement in gross margin
rate of 90 basis points and a decrease in selling and administrative expenses, which were partially offset by a decline
in gross margin dollars, given lower sales.
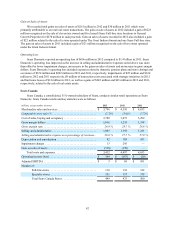
Revenues and Comparable Store Sales
Revenues decreased $1.7 billion, or 4.1%, to $39.9 billion, as compared to revenues of $41.6 billion in 2011.
The decline in revenue was primarily the result of having fewer Kmart and Sears Full-line stores in operation, which
accounted for approximately $930 million of the decline, a decrease in domestic comparable store sales of 2.5%,
which accounted for approximately $740 million of the decline, and the separation of the Sears Hometown and
Outlet businesses, partially offset by the inclusion of an additional week of revenues in 2012. The Company
recorded approximately $500 million of revenues during the 53rd week of 2012. The separation of the Sears
Hometown and Outlet businesses resulted in a net decrease in revenues of approximately $100 million. Additionally,
Sears Canada had a 5.6% decline in comparable store sales, which accounted for approximately $185 million of the
decline, and revenues for the year included a decrease of $37 million due to changes in foreign currency exchange
rates.