Sears 2013 Annual Report Download - page 39
Download and view the complete annual report
Please find page 39 of the 2013 Sears annual report below. You can navigate through the pages in the report by either clicking on the pages listed below, or by using the keyword search tool below to find specific information within the annual report.-
 1
1 -
2
-
3
-
4
-
5
-
6
-
7
-
8
-
9
-
10
-
11
-
12
-
13
-
14
-
15
-
16
-
17
-
18
-
19
-
20
-
21
-
22
-
23
-
24
-
25
-
26
-
27
-
28
-
 29
29 -
 30
30 -
 31
31 -
 32
32 -
 33
33 -
 34
34 -
 35
35 -
 36
36 -
 37
37 -
 38
38 -
 39
39 -
 40
40 -
 41
41 -
 42
42 -
 43
43 -
 44
44 -
 45
45 -
 46
46 -
 47
47 -
 48
48 -
 49
49 -
50
-
51
-
52
-
53
-
54
-
55
-
56
-
57
-
58
-
59
-
60
-
61
-
62
-
63
-
64
-
65
-
66
-
67
-
68
-
69
-
70
-
71
-
72
-
73
-
74
-
75
-
76
-
77
-
78
-
79
-
80
-
81
-
82
-
83
-
84
-
85
-
86
-
87
-
88
-
89
-
90
-
91
-
92
-
93
-
94
-
95
-
96
-
97
-
98
-
99
-
100
-
101
-
102
-
103
-
104
-
105
-
106
-
107
-
108
-
109
-
110
-
111
-
112
-
113
-
114
-
115
-
116
-
117
-
118
-
119
-
120
-
121
-
122
-
123
-
124
-
125
-
126
-
127
-
128
-
129
-
130
-
131
-
132
-
133
-
134
-
135
-
136
-
137
 |
 |

39
Sears Domestic
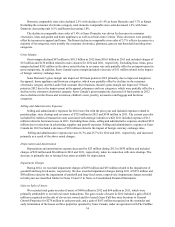
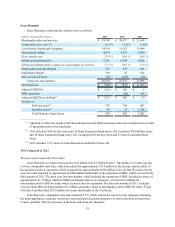
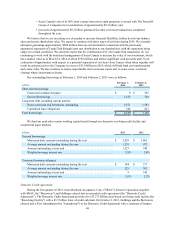
Sears Domestic results and key statistics were as follows:
millions, except number of stores 2013 2012 2011
Merchandise sales and services . . . . . . . . . . . . . . . . . . . . . . . . . . . $ 19,198 $ 20,977 $ 21,649
Comparable store sales % . . . . . . . . . . . . . . . . . . . . . . . . . . . . . . . (4.1)% (1.4)% (3.0)%
Cost of sales, buying and occupancy . . . . . . . . . . . . . . . . . . . . . . . 14,324 15,107 15,849
Gross margin dollars . . . . . . . . . . . . . . . . . . . . . . . . . . . . . . . . . . . 4,874 5,870 5,800
Gross margin rate. . . . . . . . . . . . . . . . . . . . . . . . . . . . . . . . . . . . . . 25.4 % 28.0 % 26.8 %
Selling and administrative . . . . . . . . . . . . . . . . . . . . . . . . . . . . . . . 5,216 6,184 6,042
Selling and administrative expense as a percentage of revenues. . 27.2 % 29.5 % 27.9 %
Depreciation and amortization . . . . . . . . . . . . . . . . . . . . . . . . . . . . 511 578 601
Impairment charges . . . . . . . . . . . . . . . . . . . . . . . . . . . . . . . . . . . . 150 25 634
Gain on sales of assets . . . . . . . . . . . . . . . . . . . . . . . . . . . . . . . . . . (63) (261) (30)
Total costs and expenses. . . . . . . . . . . . . . . . . . . . . . . . . . . . . 20,138 21,633 23,096
Operating loss. . . . . . . . . . . . . . . . . . . . . . . . . . . . . . . . . . . . . . . . . $ (940) $ (656) $ (1,447)
Adjusted EBITDA . . . . . . . . . . . . . . . . . . . . . . . . . . . . . . . . . . . . . $ (211) $ 356 $ 4
SHO separation . . . . . . . . . . . . . . . . . . . . . . . . . . . . . . . . . . . . . . . — (90) (81)
Adjusted EBITDA as defined(1) . . . . . . . . . . . . . . . . . . . . . . . . . . . $ (211) $ 266 $ (77)
Number of:
Full-line stores(2) . . . . . . . . . . . . . . . . . . . . . . . . . . . . . . . 778 798 867
Specialty stores(3) . . . . . . . . . . . . . . . . . . . . . . . . . . . . . . . 50 54 1,338
Total Domestic Sears Stores . . . . . . . . . . . . . . . . . . . . . . 828 852 2,205
__________________
(1) Adjusted to reflect the results of the Sears Hometown and Outlet businesses that were included in our results
of operations prior to the separation.
(2) 2013 included 768 Full-line stores and 10 Sears Essentials/Grand stores; 2012 included 788 Full-line stores
and 10 Sears Essentials/Grand stores; 2011 included 834 Full-line stores and 33 Sears Essentials/Grand
stores
(3) 2011 included 1,273 stores of Sears Hometown and Outlet Stores, Inc.
2013 Compared to 2012
Revenues and Comparable Store Sales
Sears Domestic’s revenues decreased by $1.8 billion to $19.2 billion in 2013. The decline in revenue was due
to lower comparable store sales, which accounted for approximately $515 million of the decline, and the effect of
having fewer stores in operation, which accounted for approximately $470 million of the decline. Revenues for the
year were also impacted by approximately $490 million attributable to the separation of SHO, which occurred in the
third quarter of 2012. The prior year first nine months, which included the separation of SHO, included revenues of
approximately $1.7 billion related to SHO merchandise sales to its customers, as well as $70 million for
merchandise sold to SHO for resale which occurred after the separation. The first nine months of 2013, included
revenues from SHO of approximately $1.3 billion, primarily related to merchandise sold to SHO for resale. Fiscal
2012 also benefited from $275 million of revenue attributable to the 53rd week.
Sears Domestic comparable store sales declined 4.1%, which reflects decreases in most categories including
the home appliances, consumer electronics, tools and lawn & garden categories, as well as declines at Sears Auto
Centers, partially offset by increases in the home and footwear categories.