Sears 2013 Annual Report Download - page 111
Download and view the complete annual report
Please find page 111 of the 2013 Sears annual report below. You can navigate through the pages in the report by either clicking on the pages listed below, or by using the keyword search tool below to find specific information within the annual report.-
 1
1 -
2
-
3
-
4
-
5
-
6
-
7
-
8
-
9
-
10
-
11
-
12
-
13
-
14
-
15
-
16
-
17
-
18
-
19
-
20
-
21
-
22
-
23
-
24
-
25
-
26
-
27
-
28
-
29
-
30
-
31
-
32
-
33
-
34
-
35
-
36
-
37
-
38
-
39
-
40
-
41
-
42
-
43
-
44
-
45
-
46
-
47
-
48
-
49
-
50
-
51
-
52
-
53
-
54
-
55
-
56
-
57
-
58
-
59
-
60
-
61
-
62
-
63
-
64
-
65
-
66
-
67
-
68
-
69
-
70
-
71
-
72
-
73
-
74
-
75
-
76
-
77
-
78
-
79
-
80
-
81
-
82
-
83
-
84
-
85
-
86
-
87
-
88
-
89
-
90
-
91
-
92
-
93
-
94
-
95
-
96
-
97
-
98
-
99
-
100
-
 101
101 -
 102
102 -
 103
103 -
 104
104 -
 105
105 -
 106
106 -
 107
107 -
 108
108 -
 109
109 -
 110
110 -
 111
111 -
 112
112 -
 113
113 -
 114
114 -
 115
115 -
 116
116 -
 117
117 -
 118
118 -
 119
119 -
 120
120 -
 121
121 -
122
-
123
-
124
-
125
-
126
-
127
-
128
-
129
-
130
-
131
-
132
-
133
-
134
-
135
-
136
-
137
 |
 |

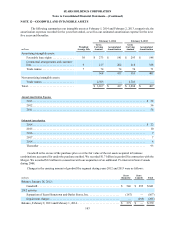
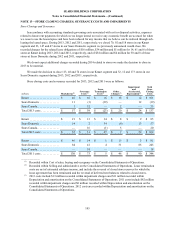
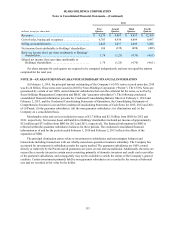
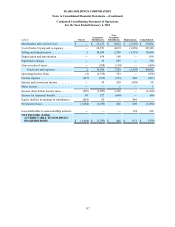
SEARS HOLDINGS CORPORATION
Notes to Consolidated Financial Statements—(Continued)
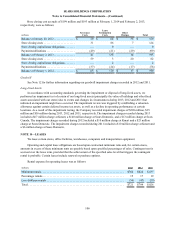
111
2012
millions Kmart Sears
Domestic Sears
Canada Sears
Holdings
Merchandise sales and services:
Hardlines . . . . . . . . . . . . . . . . . . . . . . . . . . . . . . . . . . . . . . . $ 4,486 $ 11,870 $ 2,246 $ 18,602
Apparel and Soft Home. . . . . . . . . . . . . . . . . . . . . . . . . . . . 4,588 5,434 1,856 11,878
Food and Drug. . . . . . . . . . . . . . . . . . . . . . . . . . . . . . . . . . . 5,398 38 — 5,436
Service. . . . . . . . . . . . . . . . . . . . . . . . . . . . . . . . . . . . . . . . . — 2,604 151 2,755
Other . . . . . . . . . . . . . . . . . . . . . . . . . . . . . . . . . . . . . . . . . . 95 1,031 57 1,183
Total merchandise sales and services. . . . . . . . . . . . . . 14,567 20,977 4,310 39,854
Costs and expenses:
Cost of sales, buying and occupancy. . . . . . . . . . . . . . . . . . 11,158 15,107 3,075 29,340
Selling and administrative. . . . . . . . . . . . . . . . . . . . . . . . . . 3,284 6,184 1,192 10,660
Depreciation and amortization . . . . . . . . . . . . . . . . . . . . . . 147 578 105 830
Impairment charges . . . . . . . . . . . . . . . . . . . . . . . . . . . . . . . 10 25 295 330
Gain on sales of assets. . . . . . . . . . . . . . . . . . . . . . . . . . . . . (37)(261)(170)(468)
Total costs and expenses. . . . . . . . . . . . . . . . . . . . . . . . 14,562 21,633 4,497 40,692
Operating income (loss) . . . . . . . . . . . . . . . . . . . . . . . . . . . . . . . $ 5 $ (656) $ (187) $ (838)
Total assets . . . . . . . . . . . . . . . . . . . . . . . . . . . . . . . . . . . . . . . . . $ 4,304 $ 12,648 $ 2,388 $ 19,340
Capital expenditures . . . . . . . . . . . . . . . . . . . . . . . . . . . . . . . . . . $ 122 $ 171 $ 85 $ 378
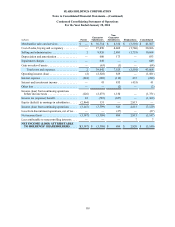
2011
millions Kmart Sears
Domestic Sears
Canada Sears
Holdings
Merchandise sales and services:
Hardlines . . . . . . . . . . . . . . . . . . . . . . . . . . . . . . . . . . . . . . . $ 4,765 $ 13,022 $ 2,377 $ 20,164
Apparel and Soft Home. . . . . . . . . . . . . . . . . . . . . . . . . . . . 4,723 5,471 2,011 12,205
Food and Drug. . . . . . . . . . . . . . . . . . . . . . . . . . . . . . . . . . . 5,705 41 — 5,746
Service. . . . . . . . . . . . . . . . . . . . . . . . . . . . . . . . . . . . . . . . . — 2,657 184 2,841
Other . . . . . . . . . . . . . . . . . . . . . . . . . . . . . . . . . . . . . . . . . . 92 458 61 611
Total merchandise sales and services. . . . . . . . . . . . . . 15,285 21,649 4,633 41,567
Costs and expenses:
Cost of sales, buying and occupancy. . . . . . . . . . . . . . . . . . 11,818 15,849 3,299 30,966
Selling and administrative. . . . . . . . . . . . . . . . . . . . . . . . . . 3,371 6,042 1,251 10,664
Depreciation and amortization . . . . . . . . . . . . . . . . . . . . . . 149 601 103 853
Impairment charges . . . . . . . . . . . . . . . . . . . . . . . . . . . . . . . 15 634 — 649
Gain on sales of assets. . . . . . . . . . . . . . . . . . . . . . . . . . . . . (34)(30) — (64)
Total costs and expenses. . . . . . . . . . . . . . . . . . . . . . . . 15,319 23,096 4,653 43,068
Operating loss. . . . . . . . . . . . . . . . . . . . . . . . . . . . . . . . . . . . . . . $(34) $ (1,447) $ (20) $ (1,501)
Total assets . . . . . . . . . . . . . . . . . . . . . . . . . . . . . . . . . . . . . . . . . $ 4,548 $ 13,913 $ 2,920 $ 21,381
Capital expenditures . . . . . . . . . . . . . . . . . . . . . . . . . . . . . . . . . . $ 118 $ 225 $ 89 $ 432