Sears 2013 Annual Report Download - page 42
Download and view the complete annual report
Please find page 42 of the 2013 Sears annual report below. You can navigate through the pages in the report by either clicking on the pages listed below, or by using the keyword search tool below to find specific information within the annual report.-
 1
1 -
2
-
3
-
4
-
5
-
6
-
7
-
8
-
9
-
10
-
11
-
12
-
13
-
14
-
15
-
16
-
17
-
18
-
19
-
20
-
21
-
22
-
23
-
24
-
25
-
26
-
27
-
28
-
29
-
30
-
31
-
 32
32 -
 33
33 -
 34
34 -
 35
35 -
 36
36 -
 37
37 -
 38
38 -
 39
39 -
 40
40 -
 41
41 -
 42
42 -
 43
43 -
 44
44 -
 45
45 -
 46
46 -
 47
47 -
 48
48 -
 49
49 -
 50
50 -
 51
51 -
 52
52 -
53
-
54
-
55
-
56
-
57
-
58
-
59
-
60
-
61
-
62
-
63
-
64
-
65
-
66
-
67
-
68
-
69
-
70
-
71
-
72
-
73
-
74
-
75
-
76
-
77
-
78
-
79
-
80
-
81
-
82
-
83
-
84
-
85
-
86
-
87
-
88
-
89
-
90
-
91
-
92
-
93
-
94
-
95
-
96
-
97
-
98
-
99
-
100
-
101
-
102
-
103
-
104
-
105
-
106
-
107
-
108
-
109
-
110
-
111
-
112
-
113
-
114
-
115
-
116
-
117
-
118
-
119
-
120
-
121
-
122
-
123
-
124
-
125
-
126
-
127
-
128
-
129
-
130
-
131
-
132
-
133
-
134
-
135
-
136
-
137
 |
 |
42
Gain on Sales of Assets
We recorded total gains on sales of assets of $261 million in 2012 and $30 million in 2011 which were
primarily attributable to several real estate transactions. The gain on sale of assets in 2012 included a gain of $223
million recognized on the sale of eleven (six owned and five leased) Sears Full-line store locations to General
Growth Properties for $270 million in cash proceeds. Gain on sales of assets recorded in 2012 also included a gain
of $22 million related to the sale of a store operated under The Great Indoors format and one Sears Full-line store.
The gain on sales of assets in 2011 included a gain of $21 million recognized on the sale of two stores operated
under the Great Indoors format.
Operating Loss
Sears Domestic reported an operating loss of $656 million in 2012 compared to $1.4 billion in 2011. Sears
Domestic’s operating loss improved as the increase in selling and administrative expenses noted above was more
than offset by lower impairment charges, an increase in the gains on sales of assets and an increase in gross margin
dollars. Sears Domestic’s operating loss included expenses related to domestic pension plans and store closings and
severance of $674 million and $242 million in 2012 and 2011, respectively, impairments of $25 million and $634
million in 2012 and 2011 respectively, $9 million of transaction costs associated with strategic initiatives in 2012
and hurricane losses of $12 million in 2011, as well as a gains of $245 million and $21 million in 2012 and 2011,
respectively, related to the sale of real estate assets.
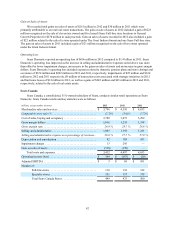
Sears Canada
Sears Canada, a consolidated, 51%-owned subsidiary of Sears, conducts similar retail operations as Sears
Domestic. Sears Canada results and key statistics were as follows:
millions, except number of stores 2013 2012 2011
Merchandise sales and services . . . . . . . . . . . . . . . . . . . . . . . . . . . $ 3,796 $ 4,310 $ 4,633
Comparable store sales % . . . . . . . . . . . . . . . . . . . . . . . . . . . . . . . (2.7)% (5.6)% (7.7)%
Cost of sales, buying and occupancy . . . . . . . . . . . . . . . . . . . . . . . 2,780 3,075 3,299
Gross margin dollars . . . . . . . . . . . . . . . . . . . . . . . . . . . . . . . . . . . 1,016 1,235 1,334
Gross margin rate. . . . . . . . . . . . . . . . . . . . . . . . . . . . . . . . . . . . . . 26.8 % 28.7 % 28.8 %
Selling and administrative . . . . . . . . . . . . . . . . . . . . . . . . . . . . . . . 1,085 1,192 1,251
Selling and administrative expense as a percentage of revenues. . 28.6 % 27.7 % 27.0 %
Depreciation and amortization . . . . . . . . . . . . . . . . . . . . . . . . . . . . 92 105 103
Impairment charges . . . . . . . . . . . . . . . . . . . . . . . . . . . . . . . . . . . . 13 295 —
Gain on sales of assets . . . . . . . . . . . . . . . . . . . . . . . . . . . . . . . . . . (538) (170) —
Total costs and expenses. . . . . . . . . . . . . . . . . . . . . . . . . . . . . 3,432 4,497 4,653
Operating income (loss) . . . . . . . . . . . . . . . . . . . . . . . . . . . . . . . . . $ 364 $ (187) $ (20)
Adjusted EBITDA . . . . . . . . . . . . . . . . . . . . . . . . . . . . . . . . . . . . . $ 3 $ 69 $ 101
Number of:
Full-line stores . . . . . . . . . . . . . . . . . . . . . . . . . . . . . . . . . 118 118 122
Specialty stores . . . . . . . . . . . . . . . . . . . . . . . . . . . . . . . . 331 357 378
Total Sears Canada Stores . . . . . . . . . . . . . . . . . . . . . . . . 449 475 500