Sears 2013 Annual Report Download - page 45
Download and view the complete annual report
Please find page 45 of the 2013 Sears annual report below. You can navigate through the pages in the report by either clicking on the pages listed below, or by using the keyword search tool below to find specific information within the annual report.-
 1
1 -
2
-
3
-
4
-
5
-
6
-
7
-
8
-
9
-
10
-
11
-
12
-
13
-
14
-
15
-
16
-
17
-
18
-
19
-
20
-
21
-
22
-
23
-
24
-
25
-
26
-
27
-
28
-
29
-
30
-
31
-
32
-
33
-
34
-
 35
35 -
 36
36 -
 37
37 -
 38
38 -
 39
39 -
 40
40 -
 41
41 -
 42
42 -
 43
43 -
 44
44 -
 45
45 -
 46
46 -
 47
47 -
 48
48 -
 49
49 -
 50
50 -
 51
51 -
 52
52 -
 53
53 -
 54
54 -
 55
55 -
56
-
57
-
58
-
59
-
60
-
61
-
62
-
63
-
64
-
65
-
66
-
67
-
68
-
69
-
70
-
71
-
72
-
73
-
74
-
75
-
76
-
77
-
78
-
79
-
80
-
81
-
82
-
83
-
84
-
85
-
86
-
87
-
88
-
89
-
90
-
91
-
92
-
93
-
94
-
95
-
96
-
97
-
98
-
99
-
100
-
101
-
102
-
103
-
104
-
105
-
106
-
107
-
108
-
109
-
110
-
111
-
112
-
113
-
114
-
115
-
116
-
117
-
118
-
119
-
120
-
121
-
122
-
123
-
124
-
125
-
126
-
127
-
128
-
129
-
130
-
131
-
132
-
133
-
134
-
135
-
136
-
137
 |
 |
45
Operating Loss
Sears Canada recorded an operating loss of $187 million and $20 million in 2012 and 2011, respectively.
Operating loss in 2012 included expenses of $20 million related to store closings and severance, $3 million related
to pension settlements and $3 million of transaction costs associated with strategic initiatives, as well as an
impairment charge of $295 million and a gain on sales of assets of $163 million in 2012. Operating loss in 2011
included expenses related to store closings and severance of $18 million. The increase in operating loss was
primarily due to the decline in sales, partially offset by the gain on sales of assets noted above as well as the
decrease in selling and administrative expenses.
ANALYSIS OF CONSOLIDATED FINANCIAL CONDITION
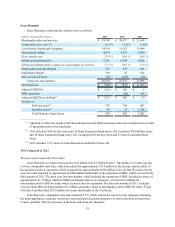
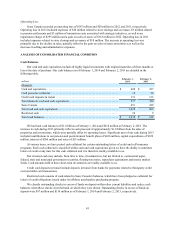
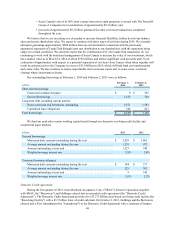
Cash Balances
Our cash and cash equivalents include all highly liquid investments with original maturities of three months or
less at the date of purchase. Our cash balances as of February 1, 2014 and February 2, 2013 are detailed in the
following table.
millions February 1,
2014 February 2,
2013
Domestic
Cash and equivalents. . . . . . . . . . . . . . . . . . . . . . . . . . . . . . . . . . . . . . . . . . . . . . . . . . . $ 428 $ 227
Cash posted as collateral. . . . . . . . . . . . . . . . . . . . . . . . . . . . . . . . . . . . . . . . . . . . . . . . 18 20
Credit card deposits in transit . . . . . . . . . . . . . . . . . . . . . . . . . . . . . . . . . . . . . . . . . . . . 131 133
Total domestic cash and cash equivalents. . . . . . . . . . . . . . . . . . . . . . . . . . . . . . . . . . . 577 380
Sears Canada. . . . . . . . . . . . . . . . . . . . . . . . . . . . . . . . . . . . . . . . . . . . . . . . . . . . . . . . . 451 229
Total cash and cash equivalents . . . . . . . . . . . . . . . . . . . . . . . . . . . . . . . . . . . . . . . . . . 1,028 609
Restricted cash . . . . . . . . . . . . . . . . . . . . . . . . . . . . . . . . . . . . . . . . . . . . . . . . . . . . . . . 10 9
Total cash balances . . . . . . . . . . . . . . . . . . . . . . . . . . . . . . . . . . . . . . . . . . . . . . . . . . . . $ 1,038 $ 618
We had total cash balances of $1.0 billion at February 1, 2014 and $618 million at February 2, 2013. The
increase in cash during 2013 primarily reflects cash proceeds of approximately $1.0 billion from the sales of
properties and investments, which were partially offset by operating losses. Significant uses of our cash during 2013
included contributions to our pension and postretirement benefit plans of $426 million, capital expenditures of $329
million, interest of $206 million and taxes of $21 million.
At various times, we have posted cash collateral for certain outstanding letters of credit and self-insurance
programs. Such cash collateral is classified within cash and cash equivalents given we have the ability to substitute
letters of credit at any time for this cash collateral and it is therefore readily available to us.
Our invested cash may include, from time to time, investments in, but not limited to, commercial paper,
federal, state and municipal government securities, floating-rate notes, repurchase agreements and money market
funds. Cash amounts held in these short-term investments are readily available to us.
Credit card deposits in transit include deposits in transit from banks for payments related to third-party credit
card and debit card transactions.
Restricted cash consists of cash related to Sears Canada’s balances, which have been pledged as collateral for
letters of credit obligations issued under its offshore merchandise purchasing program.
We classify outstanding checks in excess of funds on deposit within other current liabilities and reduce cash
balances when these checks clear the bank on which they were drawn. Outstanding checks in excess of funds on
deposit were $97 million and $114 million as of February 1, 2014 and February 2, 2013, respectively.