Sears 2013 Annual Report Download - page 122
Download and view the complete annual report
Please find page 122 of the 2013 Sears annual report below. You can navigate through the pages in the report by either clicking on the pages listed below, or by using the keyword search tool below to find specific information within the annual report.-
 1
1 -
2
-
3
-
4
-
5
-
6
-
7
-
8
-
9
-
10
-
11
-
12
-
13
-
14
-
15
-
16
-
17
-
18
-
19
-
20
-
21
-
22
-
23
-
24
-
25
-
26
-
27
-
28
-
29
-
30
-
31
-
32
-
33
-
34
-
35
-
36
-
37
-
38
-
39
-
40
-
41
-
42
-
43
-
44
-
45
-
46
-
47
-
48
-
49
-
50
-
51
-
52
-
53
-
54
-
55
-
56
-
57
-
58
-
59
-
60
-
61
-
62
-
63
-
64
-
65
-
66
-
67
-
68
-
69
-
70
-
71
-
72
-
73
-
74
-
75
-
76
-
77
-
78
-
79
-
80
-
81
-
82
-
83
-
84
-
85
-
86
-
87
-
88
-
89
-
90
-
91
-
92
-
93
-
94
-
95
-
96
-
97
-
98
-
99
-
100
-
101
-
102
-
103
-
104
-
105
-
106
-
107
-
108
-
109
-
110
-
111
-
 112
112 -
 113
113 -
 114
114 -
 115
115 -
 116
116 -
 117
117 -
 118
118 -
 119
119 -
 120
120 -
 121
121 -
 122
122 -
 123
123 -
 124
124 -
 125
125 -
 126
126 -
 127
127 -
 128
128 -
 129
129 -
 130
130 -
 131
131 -
 132
132 -
133
-
134
-
135
-
136
-
137
 |
 |
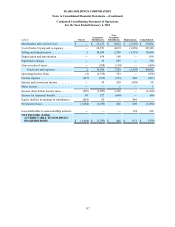
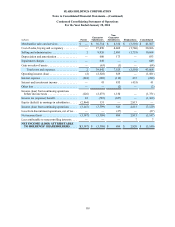
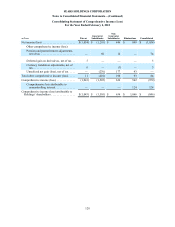
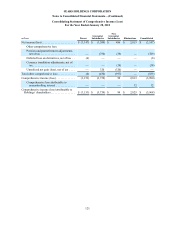
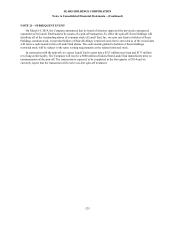
SEARS HOLDINGS CORPORATION
Notes to Consolidated Financial Statements—(Continued)
122
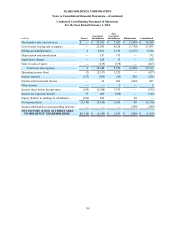
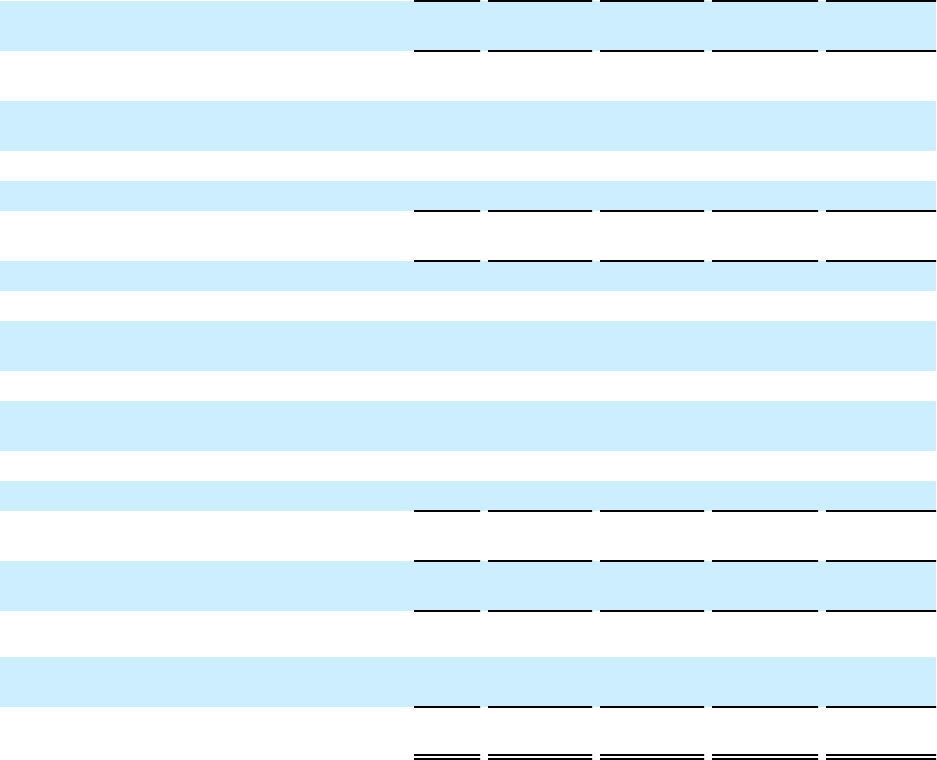
Condensed Consolidating Statement of Cash Flows
For the Year Ended February 1, 2014
millions Parent Guarantor
Subsidiaries
Non-
Guarantor
Subsidiaries Eliminations Consolidated
Net cash provided by (used in) operating
activities. . . . . . . . . . . . . . . . . . . . . . . . . . . $ — $ (2,344) $ 1,235 $ — $ (1,109)
Proceeds from sales of property and
investments . . . . . . . . . . . . . . . . . . . . . . . . — 155 840 — 995
Net increase in investments and restricted
cash . . . . . . . . . . . . . . . . . . . . . . . . . . . . . . — — (2) — (2)
Purchases of property and equipment . . . . . . —(258)(71) — (329)
Net investing with Affiliates . . . . . . . . . . . . . — — 245 (245) —
Net cash provided by (used in) investing
activities. . . . . . . . . . . . . . . . . . . . . . . . . . . —(103) 1,012 (245) 664
Proceeds from debt issuances . . . . . . . . . . . . — 990 4 — 994
Repayments of long-term debt . . . . . . . . . . . —(65)(18) — (83)
Increase in short-term borrowings, primarily
90 days or less . . . . . . . . . . . . . . . . . . . . . . — 238 — — 238
Debt issuance costs . . . . . . . . . . . . . . . . . . . . —(14) — — (14)
Sears Canada dividend paid to
noncontrolling shareholders. . . . . . . . . . . . — 243 (476) — (233)
Intercompany dividend . . . . . . . . . . . . . . . . . 604 92 (696) — —
Net borrowing with Affiliates . . . . . . . . . . . . (604) 1,180 (821) 245 —
Net cash provided by (used in) financing
activities. . . . . . . . . . . . . . . . . . . . . . . . . . . — 2,664 (2,007) 245 902
Effect of exchange rate changes on cash and
cash equivalents . . . . . . . . . . . . . . . . . . . . . . . . — — (38) — (38)
NET DECREASE IN CASH AND CASH
EQUIVALENTS. . . . . . . . . . . . . . . . . . . . . . . . — 217 202 — 419
CASH AND CASH EQUIVALENTS,
BEGINNING OF YEAR. . . . . . . . . . . . . . . . . . — 320 289 — 609
CASH AND CASH EQUIVALENTS, END OF
YEAR . . . . . . . . . . . . . . . . . . . . . . . . . . . . . . . . $ — $ 537 $ 491 $ — $ 1,028