Sears 2013 Annual Report Download - page 34
Download and view the complete annual report
Please find page 34 of the 2013 Sears annual report below. You can navigate through the pages in the report by either clicking on the pages listed below, or by using the keyword search tool below to find specific information within the annual report.-
 1
1 -
2
-
3
-
4
-
5
-
6
-
7
-
8
-
9
-
10
-
11
-
12
-
13
-
14
-
15
-
16
-
17
-
18
-
19
-
20
-
21
-
22
-
23
-
 24
24 -
 25
25 -
 26
26 -
 27
27 -
 28
28 -
 29
29 -
 30
30 -
 31
31 -
 32
32 -
 33
33 -
 34
34 -
 35
35 -
 36
36 -
 37
37 -
 38
38 -
 39
39 -
 40
40 -
 41
41 -
 42
42 -
 43
43 -
 44
44 -
45
-
46
-
47
-
48
-
49
-
50
-
51
-
52
-
53
-
54
-
55
-
56
-
57
-
58
-
59
-
60
-
61
-
62
-
63
-
64
-
65
-
66
-
67
-
68
-
69
-
70
-
71
-
72
-
73
-
74
-
75
-
76
-
77
-
78
-
79
-
80
-
81
-
82
-
83
-
84
-
85
-
86
-
87
-
88
-
89
-
90
-
91
-
92
-
93
-
94
-
95
-
96
-
97
-
98
-
99
-
100
-
101
-
102
-
103
-
104
-
105
-
106
-
107
-
108
-
109
-
110
-
111
-
112
-
113
-
114
-
115
-
116
-
117
-
118
-
119
-
120
-
121
-
122
-
123
-
124
-
125
-
126
-
127
-
128
-
129
-
130
-
131
-
132
-
133
-
134
-
135
-
136
-
137
 |
 |
34
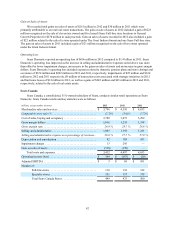
Domestic comparable store sales declined 2.5% with declines of 1.4% at Sears Domestic and 3.7% at Kmart.
Excluding the consumer electronics category, total domestic comparable store sales decreased 1.4% with Sears
Domestic decreasing only 0.1% and Kmart decreasing 2.8%.
The decline in comparable store sales of 1.4% at Sears Domestic was driven by decreases in consumer
electronics, lawn and garden and home appliances as well as at Sears Auto Centers. These decreases were partially
offset by increases in apparel and home. The Kmart decline in comparable store sales of 3.7% reflects decreases in a
majority of its categories, most notably the consumer electronics, pharmacy, grocery and household and drug store
categories.
Gross Margin
Gross margin declined $87 million to $10.5 billion in 2012 from $10.6 billion in 2011 and included charges of
$35 million and $130 million related to store closures for 2012 and 2011, respectively. Excluding these items, gross
margin declined $182 million as the above noted decline in revenues was only partially offset by an improvement in
gross margin rate. In addition, Sears Canada's gross margin included a decrease of $11 million related to the impact
of foreign currency exchange rates.
Sears Domestic's gross margin rate improved 120 basis points in 2012 primarily due to improved margins in
the apparel, home appliance and footwear categories, which were partially offset by declines in the consumer
electronics category and the Lands' End customer direct business. Kmart’s gross margin rate improved 70 basis
points in 2012 due to the improvement in the apparel, pharmacy and toys categories, which were partially offset by a
decline in the consumer electronics category. Sears Canada’s gross margin rate decreased 10 basis points in 2012
due to declines in the fitness and recreation, children's wear, jewelry, accessories and luggage and footwear
categories.
Selling and Administrative Expenses
Selling and administrative expenses for 2012 were flat with the prior year and included expenses related to
pension plans, store closings and severance of $725 million in 2012 and $198 million in 2011. The current year also
included $12 million of transaction costs associated with strategic initiatives while 2011 included expense of $12
million related to hurricane losses in 2011. Excluding these items, selling and administrative expenses declined $531
million due to reductions in advertising, supplies and payroll expenses. Selling and administrative expenses at Sears
Canada for 2012 included a decrease of $10 million related to the impact of foreign currency exchange rates.
Selling and administrative expense rate was 26.7% and 25.7% for 2012 and 2011, respectively, and increased
primarily as a result of the above noted charges.
Depreciation and Amortization
Depreciation and amortization expense decreased by $23 million during 2012 to $830 million and included
charges of $22 million and $8 million in 2012 and 2011, respectively, taken in connection with store closings. The
decrease is primarily due to having fewer assets available for depreciation.
Impairment Charges
During 2012, we recorded impairment charges of $295 million and $35 million related to the impairment of
goodwill and long-lived assets, respectively. We also recorded impairment charges during 2011 of $551 million and
$98 million related to the impairment of goodwill and long-lived assets, respectively. Impairment charges recorded
in both years are described further in Notes 12 and 13 in Notes to Consolidated Financial Statements.
Gain on Sales of Assets
We recorded total gains on sales of assets of $468 million in 2012 and $64 million in 2011, which were
primarily attributable to several real estate transactions. The gain on sale of assets in 2012 included a gain of $223
million recognized on the sale of eleven (six owned and five leased) Sears Full-line store locations to General
Growth Properties for $270 million in cash proceeds, and a gain of $163 million recognized on the surrender and
early termination of the leases on three properties operated by Sears Canada, under an agreement with The Cadillac