Sears 2013 Annual Report Download - page 40
Download and view the complete annual report
Please find page 40 of the 2013 Sears annual report below. You can navigate through the pages in the report by either clicking on the pages listed below, or by using the keyword search tool below to find specific information within the annual report.-
 1
1 -
2
-
3
-
4
-
5
-
6
-
7
-
8
-
9
-
10
-
11
-
12
-
13
-
14
-
15
-
16
-
17
-
18
-
19
-
20
-
21
-
22
-
23
-
24
-
25
-
26
-
27
-
28
-
29
-
 30
30 -
 31
31 -
 32
32 -
 33
33 -
 34
34 -
 35
35 -
 36
36 -
 37
37 -
 38
38 -
 39
39 -
 40
40 -
 41
41 -
 42
42 -
 43
43 -
 44
44 -
 45
45 -
 46
46 -
 47
47 -
 48
48 -
 49
49 -
 50
50 -
51
-
52
-
53
-
54
-
55
-
56
-
57
-
58
-
59
-
60
-
61
-
62
-
63
-
64
-
65
-
66
-
67
-
68
-
69
-
70
-
71
-
72
-
73
-
74
-
75
-
76
-
77
-
78
-
79
-
80
-
81
-
82
-
83
-
84
-
85
-
86
-
87
-
88
-
89
-
90
-
91
-
92
-
93
-
94
-
95
-
96
-
97
-
98
-
99
-
100
-
101
-
102
-
103
-
104
-
105
-
106
-
107
-
108
-
109
-
110
-
111
-
112
-
113
-
114
-
115
-
116
-
117
-
118
-
119
-
120
-
121
-
122
-
123
-
124
-
125
-
126
-
127
-
128
-
129
-
130
-
131
-
132
-
133
-
134
-
135
-
136
-
137
 |
 |
40
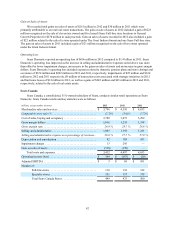
Gross Margin
Sears Domestic generated gross margin dollars of $4.9 billion and $5.9 billion in 2013 and 2012, respectively.
Gross margin for 2013 and 2012 included charges related to store closures of $11 million and $14 million,
respectively. The prior year also included gross margin of $432 million from SHO. Excluding these items, gross
margin decreased $567 million.
Sears Domestic’s gross margin rate was 25.4% in 2013 and 28.0% in 2012. The decrease of 260 basis points in
2013 was due to selling merchandise to SHO at cost pursuant to the terms of the separation as expected and
previously disclosed, which accounted for approximately 120 basis points of the decline. Gross margin rate was also
impacted by transactions that offer both traditional promotional marketing discounts and Shop Your Way Points.
Sears Domestic experienced margin decreases in the home appliances and apparel categories.
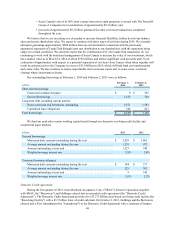
Selling and Administrative Expenses
Sears Domestic’s selling and administrative expenses decreased $968 million in 2013 as compared to 2012.
Selling and administrative expenses were impacted by expenses related to domestic pension plans, store closings
and severance of $120 million and $647 million in 2013 and 2012, respectively. The prior year also included
expenses of $343 million related to SHO and $9 million of transactions costs associated with strategic initiatives.
Excluding these items, selling and administrative expenses decreased by $89 million primarily due to a decline in
payroll expenses.
Sears Domestic’s selling and administrative expense rate was 27.2% in 2013 and 29.5% in 2012 and decreased
as a result of the above noted significant items.
Depreciation and Amortization
Depreciation and amortization expense decreased $67 million in 2013 to $511 million and included charges of
$2 million and $13 million in 2013 and 2012, respectively, taken in connection with store closings. The decrease is
primarily attributable to having fewer assets available for depreciation.
Impairment Charges
Sears Domestic recorded impairment charges of $150 million and $25 million in 2013 and 2012, respectively,
related to the impairment of long-lived assets. Impairment charges recorded in both years are described further in
Notes 12 and 13 in Notes to Consolidated Financial Statements.
Gain on Sales of Assets
Sears Domestic recorded total gains on sales of assets of $63 million in 2013 and $261 million in 2012 which
were primarily attributable to several real estate transactions. The gain on sales of assets in 2013 included a gain of
$43 million related to the sale of a store previously operated under The Great Indoors format and two Sears Full-line
stores for which the Company received $74 million in proceeds. The gain on sales of assets in 2012 included a gain
of $223 million recognized on the sale of eleven (six owned and five leased) Sears Full-line store locations to
General Growth Properties for $270 million in cash proceeds. Gain on sales of assets recorded in 2012 also included
a gain of $22 million related to the sale of a store operated under The Great Indoors format and one Sears Full-line
store.
Operating Loss
Sears Domestic reported an operating loss of $940 million in 2013 compared to $656 million in 2012. Sears
Domestic’s operating loss in 2013 included expenses related to domestic pension plans, store closings, store
impairments and severance, as well as gains on the sales of assets which aggregated to an operating loss of $240
million. Operating loss in 2012 included expenses related to domestic pension plans, store closings, store
impairments, severance and transaction costs, as well as gains on the sales of assets and operating income from SHO
which aggregated to an operating loss $380 million. Excluding these items, Sears Domestic would have reported an
operating loss of $700 million and $276 million in 2013 and 2012 respectively. The increase in operating loss in